
50+ Mind Blowing Stats on the Biggest Internet Companies in 2021

Online industries have seen big changes after a rollercoaster ride in 2020. The online market experienced its biggest shift in basically forever, so we thought we’d give you the lowdown on the largest internet companies in 2021.
Why? There are some major winners amongst online industries, with many big movers forcing their way to the top of their respective sectors.
There are also some specific sectors that have struggled online (spoiler alert: travel is one of them). Generally, though, online companies have flourished during the pandemic. That’s because so many people have flooded online searching for something to do (or buy) during the height of lockdown.
We’ll be breaking down the key metrics for top online companies in sectors that have been thriving (or diving) in recent months.
So don't go anywhere, because here are 50+ stats on the largest internet companies in 2021.
The Biggest Public Internet Companies in the World
Let’s take a look at the 15 biggest online companies around the world (as per companiesmarketcap.com).
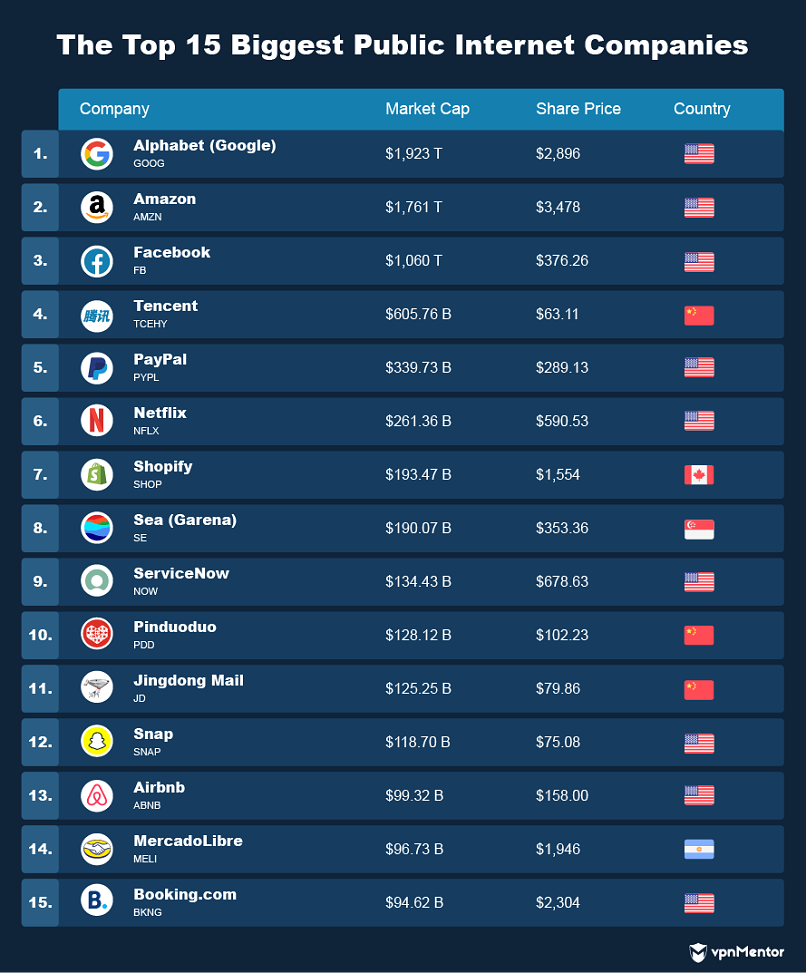
There are some unsurprising entries on this list, with Amazon and Google the 2 biggest online companies in 2021.
Google is ever-present and, given the surge in global e-commerce usage during the COVID-19 pandemic, Jeff Bezos and Amazon have only served to strengthen their position near the top of this list.
American software company ServiceNow has risen to prominence in recent times, while PayPal has enjoyed record profits over the last 12-18 months.
Google Covers All Industries
Before we break down internet companies on an industry-by-industry basis, we should start by looking at arguably the most influential internet company of all time: Google.
Google and Amazon are constantly battling it out for the top spot as the biggest online company. Amazon’s e-commerce success meant the marketplace soared to an ultra-high valuation, but recent successes from Google have seen the big tech brand regain supremacy.
Amazon is influential in several industries, but perhaps this is where Google excels. Google provides solutions for an endless list of customer needs, whether that’s web surfing, video streaming, advertising, or navigation.
In fact, there are over 271 Google products and services. We don’t have time to list all of them (you’d be reading for a long time), so here are a few of Google’s most popular products and services in 2021:
- Google Search Engine
- Google Chrome Search Engine
- Chromecast
- Gmail
- Google News
- Google Maps
- Google Analytics
- Google Assistant
- Google AdWords
- Google AdSense
- Google Workspace
- Google Docs
- Google Cloud
- Google Drive
- Google Contacts
- Google Calendar
- Google Play
- Google Meet
- Google Finance
- Google Fit
- Google Books
- Google Scholar
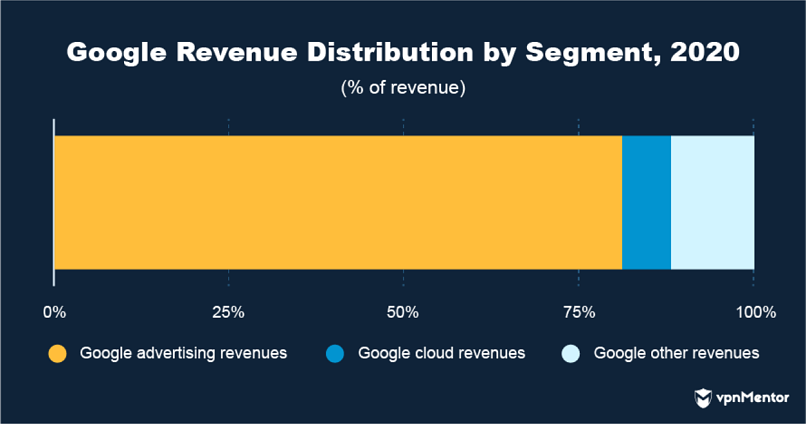
Google (Alphabet) also owns and runs separate services that contribute to its overall revenue.
The biggest of these include:
- YouTube
- Android OS
- Android TV
Not to mention all of the technology and hardware that Google is investing in, such as phones, laptops, and AI systems. These devices all use the internet, but they are not strictly “online products,” so they don’t make the above list.
So what are the key statistics on Google? How has it performed financially over the last few years? What services make up the bulk of its revenue? And how does the company invest?
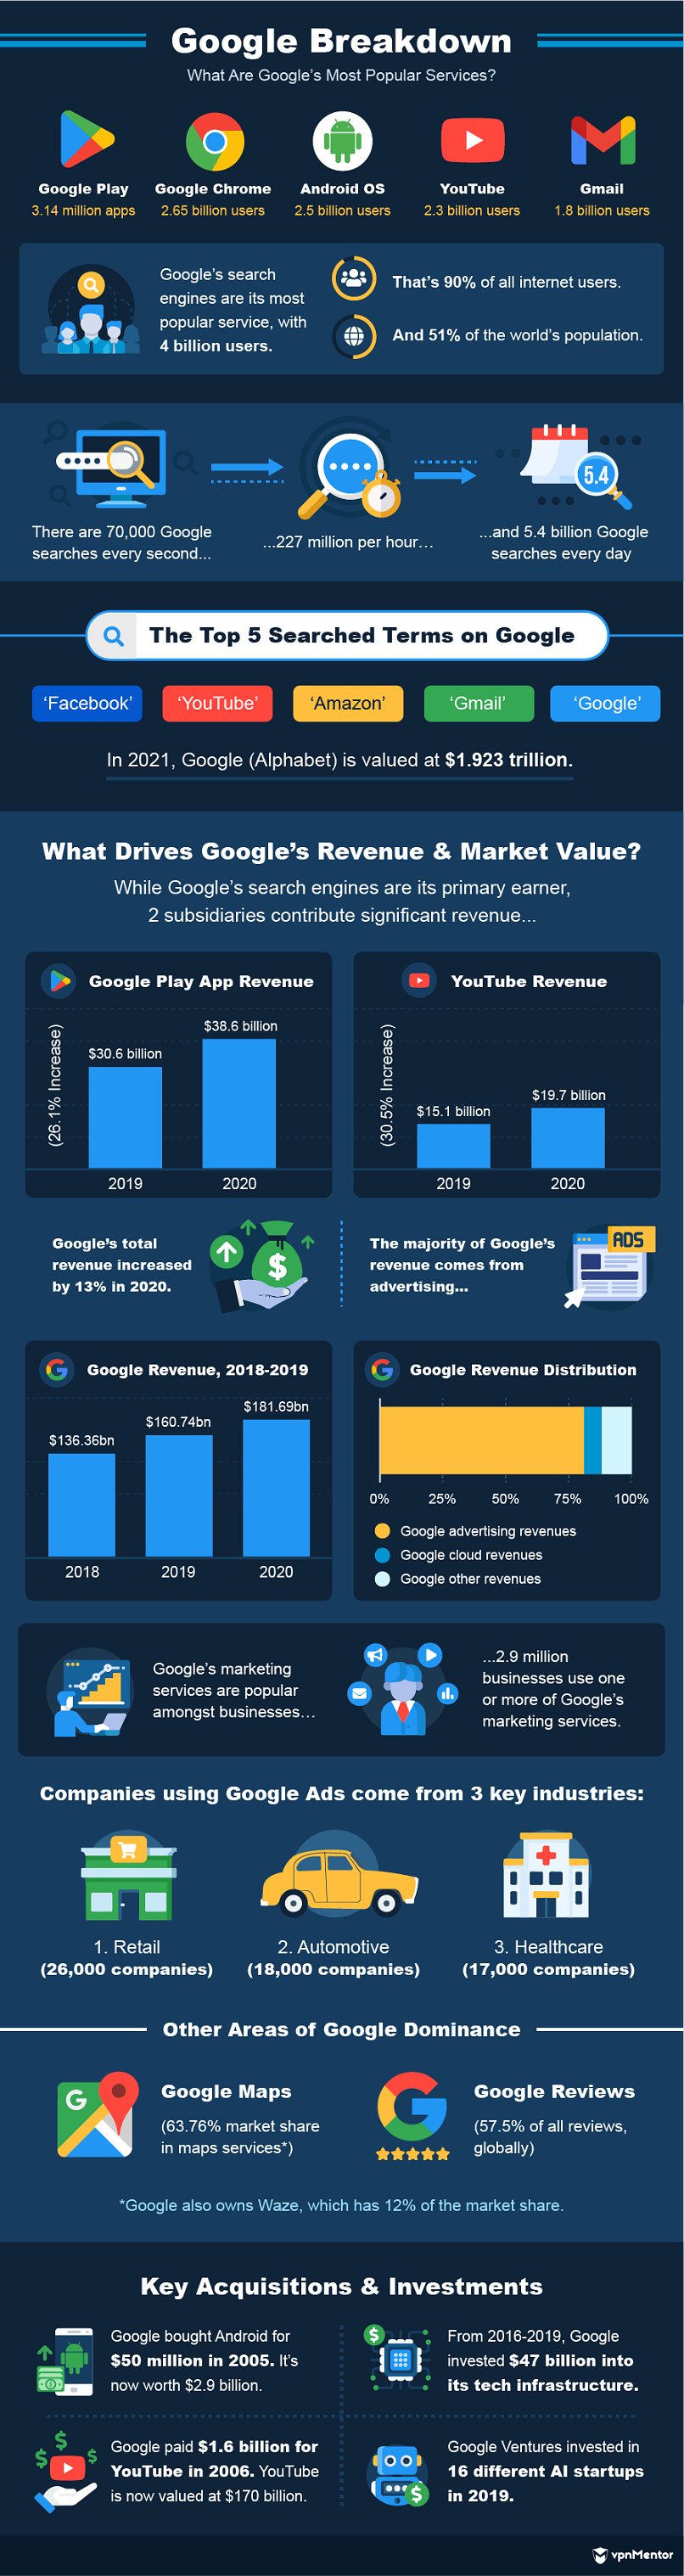
Google’s a pretty big player as far as internet companies go, with streaming services, marketing tools, analytics, word-processing, operating systems, social platforms, and just about any other tech-related product or service you can think of.
That’s why Google might be the most important internet company right now. Its reach spans across a multitude of industries, while Google’s services have a big part to play in almost all of them.
Biggest Winners & Losers of 2020
2020 wasn’t a good year for many of us. That is, unless you own a top online company. In which case, there’s every chance the pandemic has been very kind to you indeed.
Online industries such as e-commerce and streaming have profited greatly from the pandemic, while others have not been so fortunate. Here are the biggest winners and losers of 2020.
1. The Rise of E-Commerce
E-commerce is one such industry that has benefited greatly from the COVID-19 pandemic.
Consumers have been forced to spend their money online, given that almost every top high-street retailer had to close its doors to help slow the spread of the COVID-19 virus.
For many people, the experience of shopping online has been aided by developments in customer experience systems, faster delivery times, and improved payment methods (think: Apple Pay, for example).
Customers have realized that online shopping is actually easier than they first thought, and the effects of this revelation look like they’re here to stay.
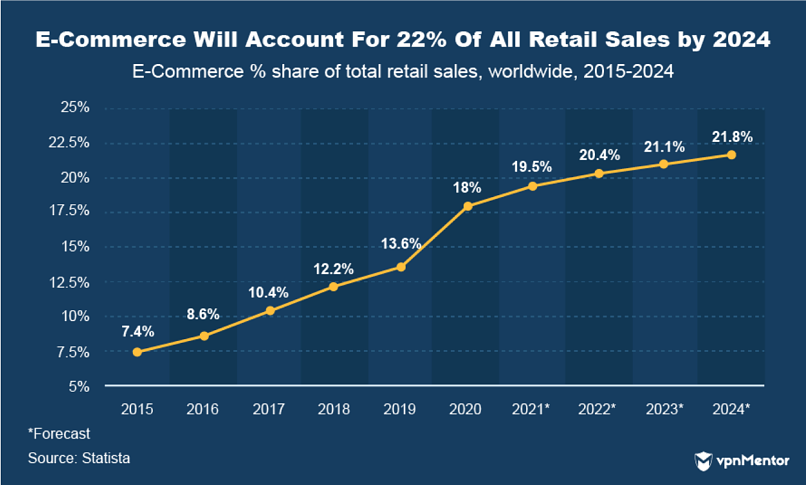
E-commerce accounted for 35.2% of all UK retail in January 2021. That’s a 74% growth in share compared to January 2020. The number of purchases made online is only expected to increase over the next few years.
Nasdaq even estimates that, by 2040, 95% of all retail sales will be through e-commerce platforms. A market that should reach $4.97 trillion in 2021. That’s a growth of nearly 400% in 7 years.
So, yeah, e-commerce is doing very well — and don’t expect that to change anytime soon.
2. Social Media Usage Increases
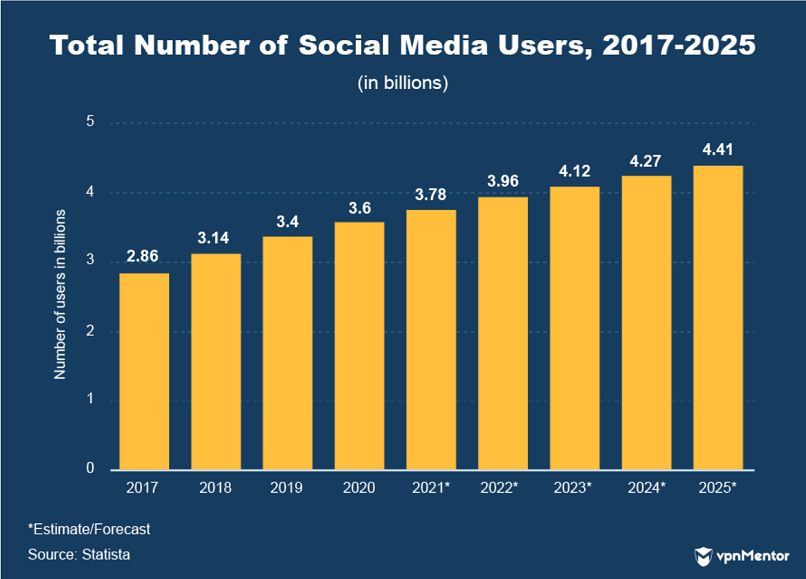
Social media has seen a marked rise in use throughout the last few years, and 2020 was no different.
2020 saw one of the biggest jumps in social media use in recent memory. It’s estimated that 3.6 billion people accessed social media in 2020 — up 200 million users on the year before — and the number of monthly active users will continue to climb.
3.8 billion users are expected to hit platforms in 2021. That means social media users will account for 49% of the global population. Nearly 4 billion users are forecasted for 2022.
Social media use has risen nearly 12% since 2019, as people around the world try out new forms of online entertainment.
3. Food Delivery Apps Profit
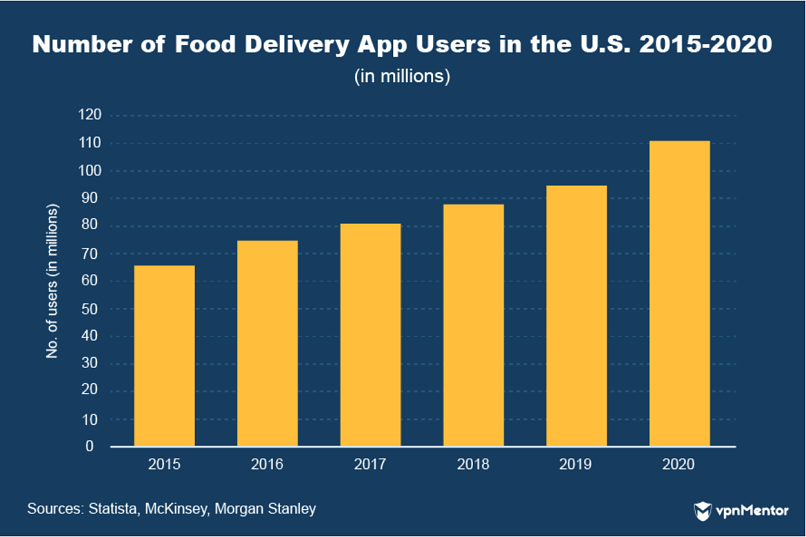
People ordered a lot of food during the pandemic. As such, food delivery apps have enjoyed record numbers.
Regular restaurants were closed across many countries as social distancing measures rendered public spaces unusable.
Takeaways were allowed to stay operational, given they are a low-contact service, and foodies flocked to food aggregators and delivery services as a result.
More than 110 million people used food apps in the U.S. alone in 2020, generating a combined revenue of $26.5 billion. That’s a 20.5% increase in revenue compared to 2019.
Globally, the food delivery app market is estimated to be worth around $120 billion in 2021, and post-pandemic momentum is expected to continue over the next few years. No sooner than 2027, the food delivery app market will be worth $300 billion.
4. Ride-Hailing Services Plummet
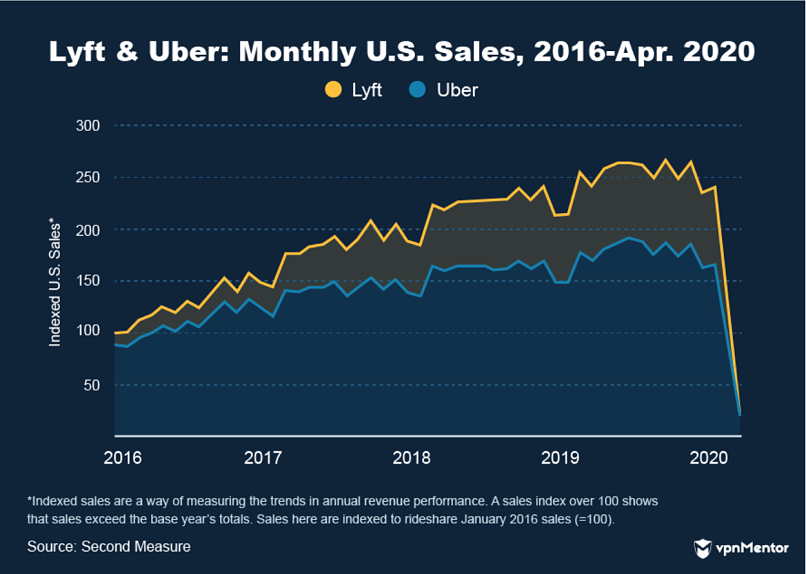
Lyft and Uber are the 2 primary players in the U.S. ride-hailing market. Their sharp decrease in sales is, in fact, characteristic of the general market, as lockdowns and travel bans rendered ride-hailing essentially obsolete.
The market would begin its recovery in the third quarter of 2020, but not before significant damage had already taken place. Again, Lyft and Uber are fine examples of the losses seen by ride-hailing services.
In 2020, Lyft lost one-third of its revenue compared to 2019, decreasing from $3.6 billion to $2.4 billion in 2020. Uber suffered losses of 21%, sinking to $11.1 billion of revenue by the end of 2020.
5. People Are Streaming More Video
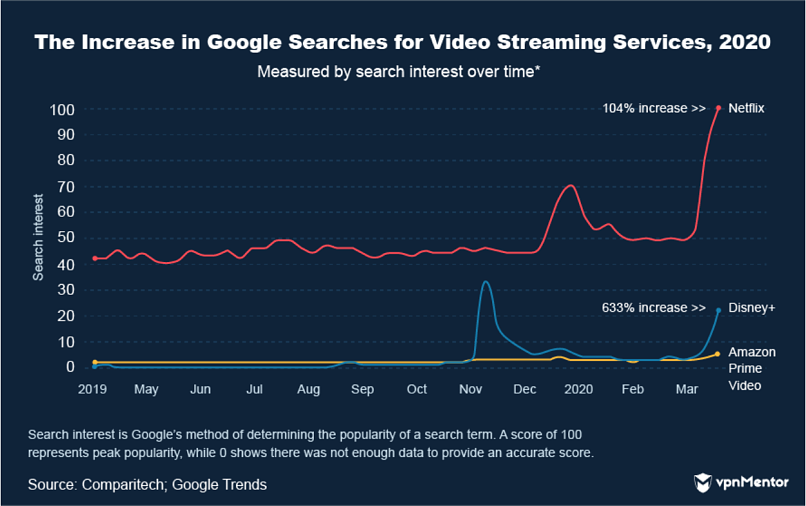
Video streaming is another obvious winner amongst internet companies. Furloughed staff and those forced to stay at home invariably turned to video streaming services to pass the time in 2020.
This saw some of the major platforms enjoy a massive boost in subscribers. Netflix alone gained 28 million new subscribers in 2020 to take its total above 200 million.
Netflix wasn’t the only video streaming service to benefit either; nearly all streaming platforms did. Amazon Prime soared across the 150 million subscriber mark, while iQIYI and Disney+ also enjoyed a fruitful year.
Overall, the market is expanding at a pretty-rapid “compound annual growth rate” (CAGR) of 21%. That means the industry is getting 21% bigger every year right now, growth that will see video streaming worth $223.98 billion by 2028.
6. Music Streaming Increased Around the World
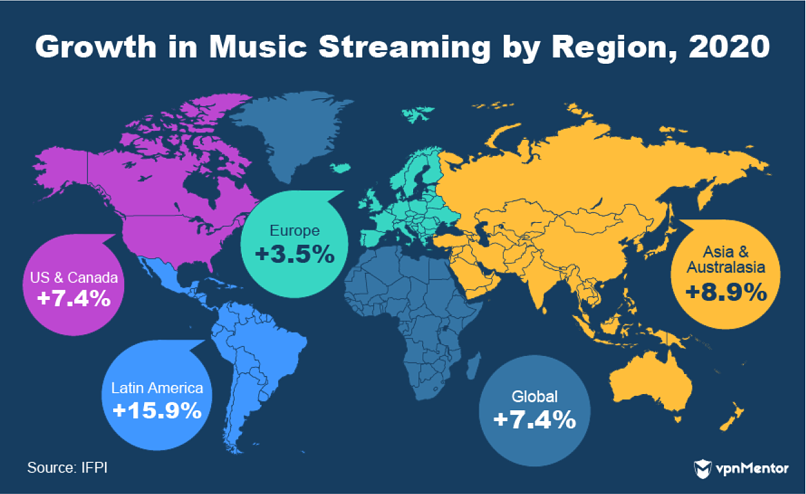
In a similar vein to video streaming, music streaming is a highly successful online industry at this moment in time.
People had more time on their hands in 2020, and the ban on social gatherings, nightclubs, bars, and gigs meant lovers of music had to get their fix elsewhere.
Enter the likes of Spotify, Apple Music, and Tidal: platforms that make listening to your favorite music as easy as tapping the play button on your smartphone screen.
The market saw significant growth across almost every region in the world in 2020, even achieving double figures for growth in Latin America (who, by the way, also loved to stream video in 2020).
The music streaming market’s rate of expansion doesn’t quite match that of video streaming over the next few years, but it’s still massively significant. The music streaming market will grow at a CAGR of 17.8% from 2020 to 2027, eventually reaching a value of $76.8 billion.
7. Dating Apps Perform During COVID-19
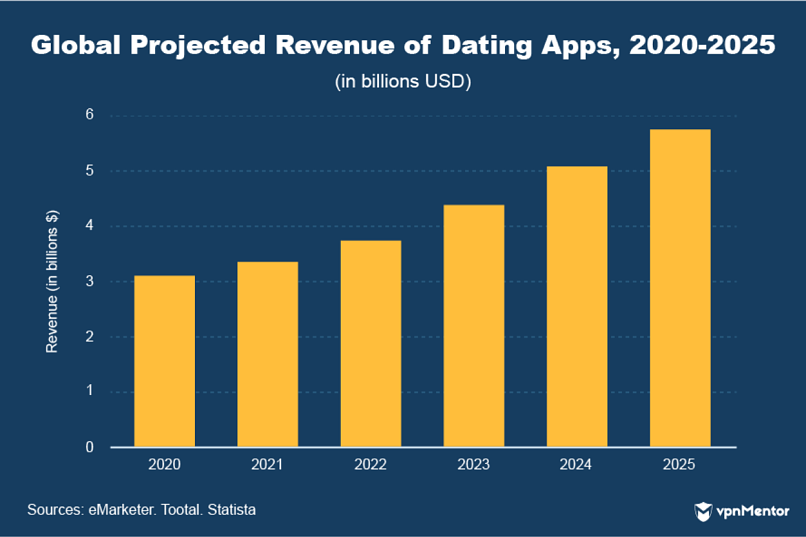
Looking for love has never been easier than it is today. Technology has allowed us to enjoy greater social connectivity. The momentum that dating apps have right now is another signifier that social platforms are growing in influence by the minute.
Dating apps like Tinder and Bumble allow you to meet a host of potential companions every day. Just swipe right to show you’re interested, and if the person you liked does the same, voila! It’s a match!
In the absence of any social activity, people turned to dating apps to get their fix of spontaneous interaction. Dating apps saw an increase in user base of 8% in 2020, and that momentum will continue heading into the future.
In fact, after significant increases throughout the year, many apps saw another boost in downloads as lockdowns were eased in the second half of 2020. That means people are more eager to use dating apps after lockdown, as they begin to look for a potential partner as soon as social distancing measures are relaxed.
This places dating apps in a good position, with COVID-19 propelling the industry into potential revenues of $6 billion in 2025.
8. The Gig Economy Grows
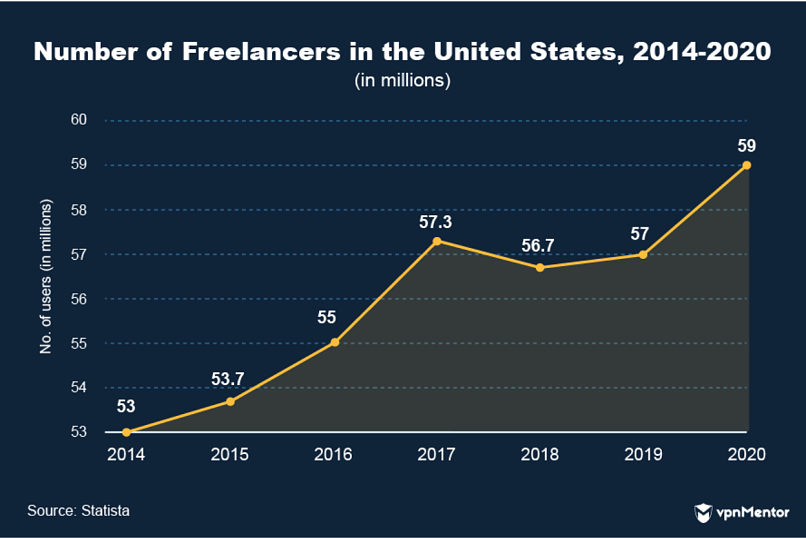
In the United States and across the world, the pandemic saw significant growth in the number of freelance workers.
Many employees were either furloughed or relieved of their jobs during the outbreak of COVID-19. People had to look for new ways to make money, and for many, freelancing was the best option.
After a period in which freelancing plateaued, the number of U.S. freelancers grew from 57 million to 59 million in 2020.
And where do new freelancers go to find work? Freelancing platforms are the destination of choice for many new freelancers, with quick and easy methods for finding work and getting paid.
According to Business2Community, 71% of online freelance platform users reported an increase in the amount of work they could attract in 2020. So, more businesses were using these services too!
9. Online Travel Apps Rendered Obsolete
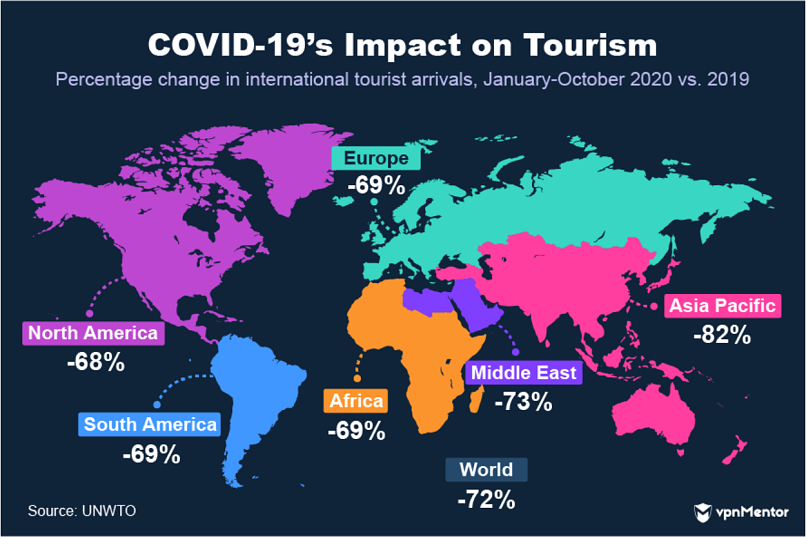
Amidst lockdowns, the closure of international borders, and general efforts to slow the spread of the virus, travel and tourism became a forgotten industry.
International tourism fell by 72% throughout the first 3 quarters of 2020, with airlines, hotels, and travel booking apps all feeling the brunt of COVID-19’s impact.
A drop of around 1 billion tourists in 2020 resulted in overall losses of an estimated $1.2 trillion for the travel industry. Online travel companies were severely affected, too, with minimal bookings and significant revenue losses across the top platforms.
10. Telemedicine Usage Increases

Telemedicine may not be an industry you’re entirely aware of, so allow me to enlighten you.
Telemedicine platforms let you access medical information, consultation, products, or other health-related services online. It’s basically a way to get checked up without having to go into the hospital.
Now, for a multitude of reasons, telemedicine did very well in 2020. Hospital admissions dropped across the world as many patients were too afraid to visit a clinic. Telemedicine offered people the chance to see a medical professional from the comfort of their own home, without having to face the risk of catching COVID-19 in a healthcare facility.
Unfortunately, the added pressures of COVID-19 led to stress, anxiety, depression, and various other mental health problems for many worried citizens. Telemedicine provided a source of support to these people, and the industry profited as a result.
The global telemedicine market grew to just under $60 billion in 2020. That growth should now continue at a rate of 22.4% between 2021 and 2028.
Social Media
Social media is a key beneficiary of the recent prevalence of online communications.
More people are online now than ever, so it stands to reason that more people are flooding the social platforms we love to use.
There are some big movers here, while top companies like Facebook have continued to perform.
11. Which Socials Get Used the Most?
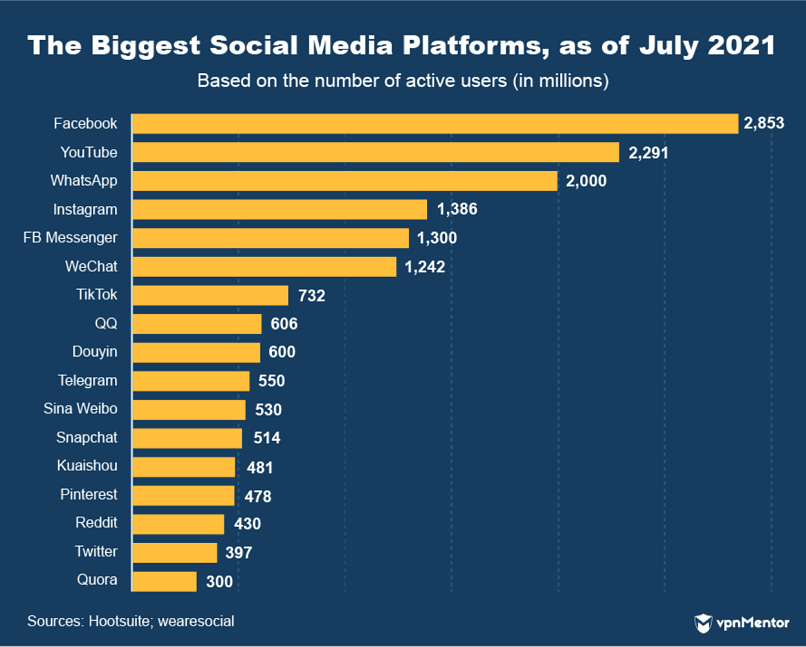
So which social media site do people love the most? Facebook tops the pile (as you might expect), but there are some other interesting platforms to feature on the list of most-used social media sites.
YouTube comes second to Facebook, cementing itself as the Earth’s favorite video-orientated social media platform, while WhatsApp checks out as the most popular messaging service.
WeChat is huge in Asia (as we’ll come to in a moment), while Sina Weibo and Douyin — Asia’s version of TikTok — are 2 more massive online platforms from the continent.
Some people may be surprised to see Twitter so far down on this list and Pinterest on an upward trajectory. No social media site has gained popularity quite like TikTok, however, which has been the biggest mover over the last couple of years.
12. TikTok Is the Biggest Mover
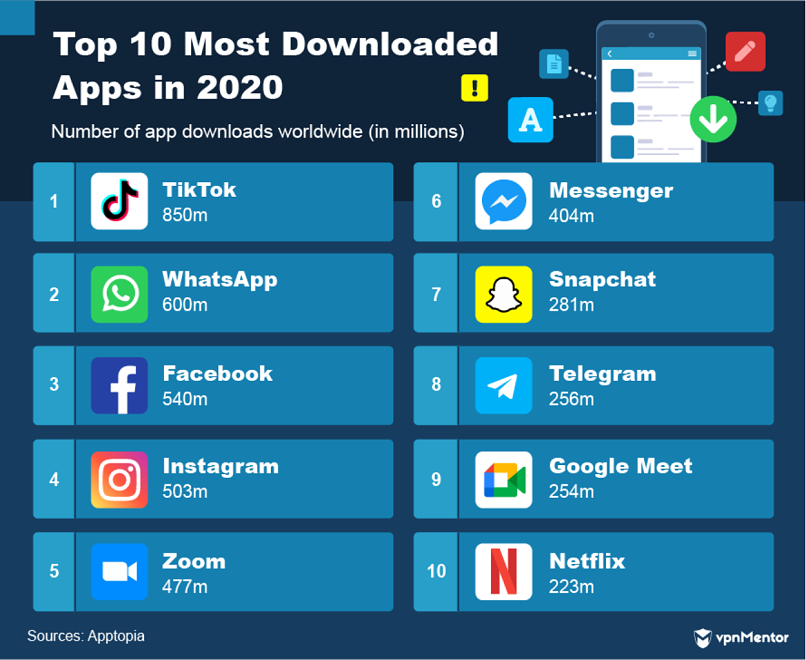
TikTok gained more popularity in 2020 than any other social media app. Actually, it’s gained more popularity than any other app, full stop.
The likes of Zoom, Telegram, and Netflix also feature, but social media apps dominate the top 10 most downloaded list for 2020.
None more so than TikTok, however.
TikTok was launched in China as “Douyin” in September 2016, allowing users to create 15-second bite-size video clips with accompanying soundtracks.
It’s safe to say the app has caught on since, especially amongst Gen Zers, with 732 million active monthly TikTok users worldwide. The company soared to a valuation of $50 billion in 2020, posting revenues of around $1 billion. That’s a 450% increase from the $180 million TikTok posted the year before.
Undoubtedly, TikTok is the biggest social media mover at this moment in time.
13. Facebook Still Number One
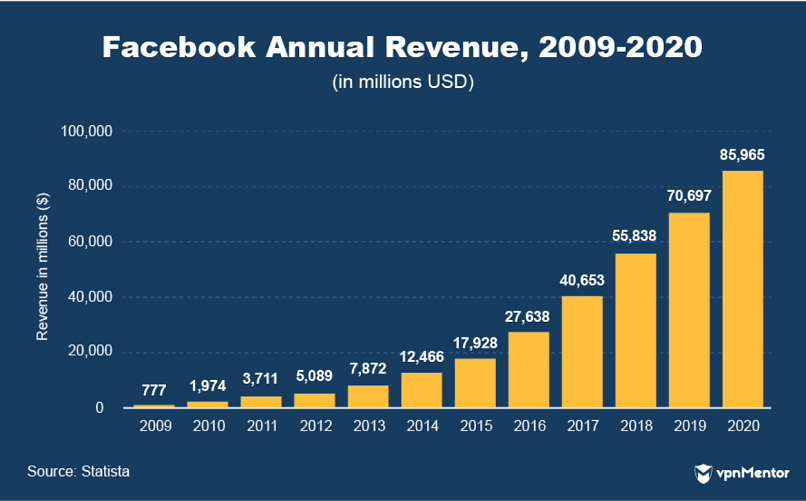
Mark Zuckerberg’s social media juggernaut continues its relentless domination. Not only is it still the number one platform amongst users, but Facebook has seen significant growth throughout 2020.
Facebook is home to some 2.85 billion active monthly users. That’s 36% of the world’s population logging on to Facebook every month.
59% of all social media users have a Facebook account, while it’s the third most-visited website and the second most downloaded app of all time.
1.3 billion users access Facebook’s messenger app. In total, Facebook’s revenue grew from around $71 billion in 2019 to a whopping $86 billion in 2020. Ridiculous.
14. WeChat Biggest in China
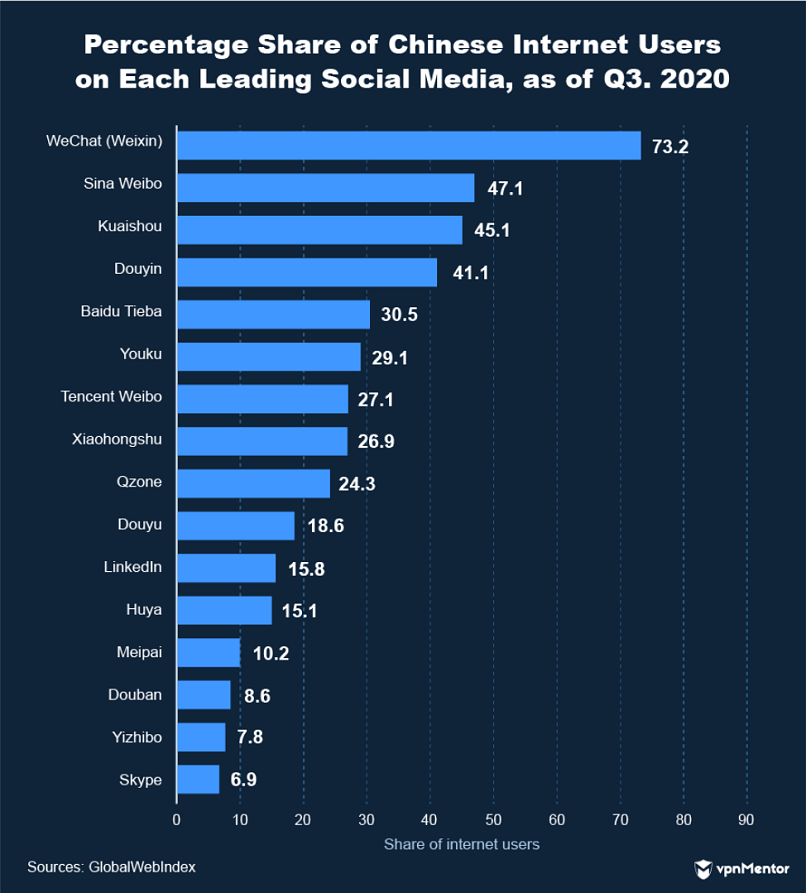
Tencent’s WeChat app may not be familiar to some readers, but make no mistake, this is a massive player amongst all internet companies.
Founded in Shenzhen in 2011 by Allen Zhang, WeChat attracts 1.24 billion monthly active users in 2021. WeChat is by far the most popular social media platform in China, with roughly 74% of its users residing in the Asian nation.
This kind of fame has led the app to post stupendous financial results. Between WeChat and other internet services, Tencent’s revenue grew to 482 billion CNY in 2020 — a 28% increase from 2019.
15. Snapchat Is Resurgent
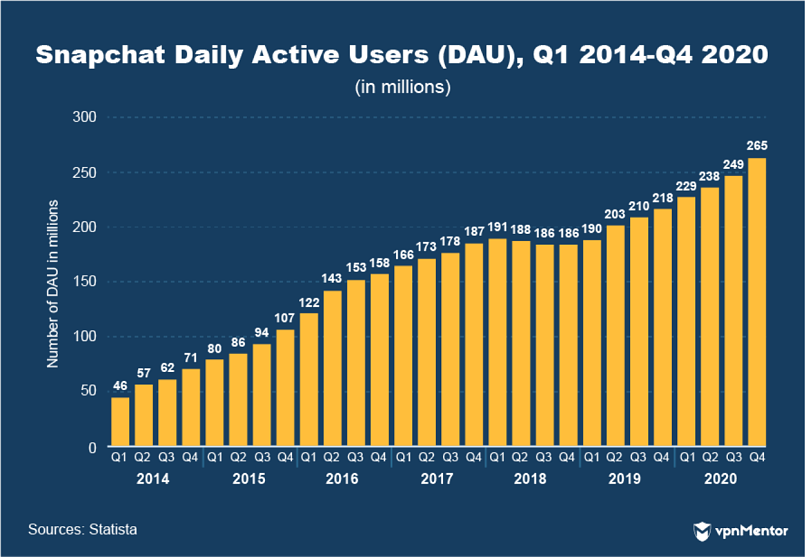
Snapchat was founded in 2011 by Evan Spiegel. Over its 10-year lifespan, the app has developed into one of the most popular social media services with 514 million active users.
Snapchat is the 7th most popular app in the USA, with an estimated 46 million Americans using Snapchat at least once a month. Snapchat’s user base is generally younger too. 60% of Snapchat users are aged between 13 and 24-years old.
Many thought Snapchat was declining in 2018 as its user base began to steadily diminish throughout the year. But in 2019, Snapchat’s user base once again started to climb. Fast-forward to 2020, and Snapchat was one of the biggest beneficiaries of the pandemic.
The demand for greater social connectivity, along with a rise in short-video consumption, likely has a lot to do with Snapchat’s resurgence. Both of these elements are key to Snapchat’s service.
Some 18 billion videos are now consumed on the platform every day. Meanwhile, 95% of Snapchat users in a survey say they enjoy the app because it makes them “feel good.”
This emphasis on 2 trending characteristics means Snapchat is also benefiting financially. In 2020, Snapchat made $2.5 billion in revenue. That’s a 47% increase from 2019 ($1.7 billion).
16. Video Helps Pinterest
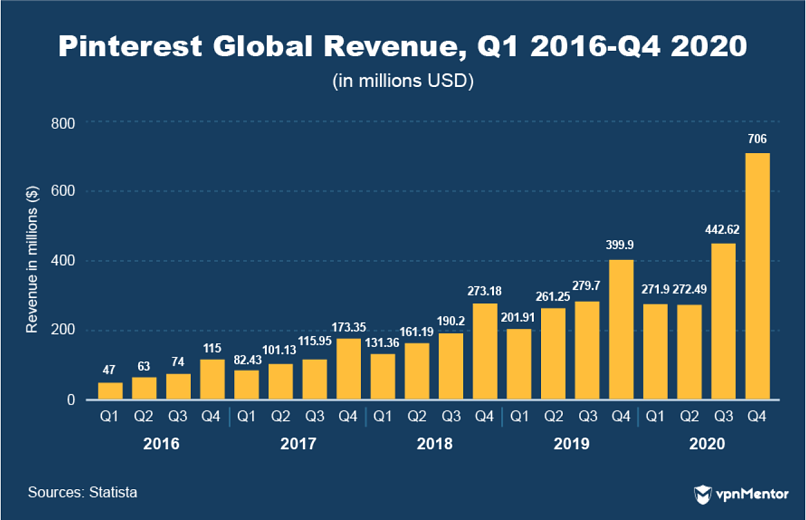
Pinterest is another online social media company that’s enjoyed an upward trajectory in 2020.
Now featured as the 38th most valuable online company in 2021, Pinterest attracts 478 million active users, gaining over 100 million users in 2020 alone. A 37% increase from the year before.
Amongst other reasons, this rise in users has facilitated a massive leap in revenues in late 2020. In the fourth quarter of 2020, Pinterest posted $706 million in revenue. That’s a 76.5% increase compared to the year before.
Pinterest’s new features are playing a role in its current success too. Pinterest’s Gen Z audience grew by 40% after the platform added fresh video elements.
Video is also contributing to record amounts of ad revenue. In Q4 2020, Pinterest made $123 million in ad revenue, which created a sharp rise in overall revenue.
To put that into perspective, Pinterest generated just $50 million in ad revenue throughout the same quarter of 2019.
Streaming
Streaming is another market that’s thriving in 2021. The increased downtime caused by COVID-19 has boosted just about every growth metric for streaming platforms.
People love to stream their content right now. The industry looks unstoppable, with major players like Netflix enjoying a stellar performance in 2020, while new platforms like Disney+ are growing at a high rate.
17. Video Streaming Market Share
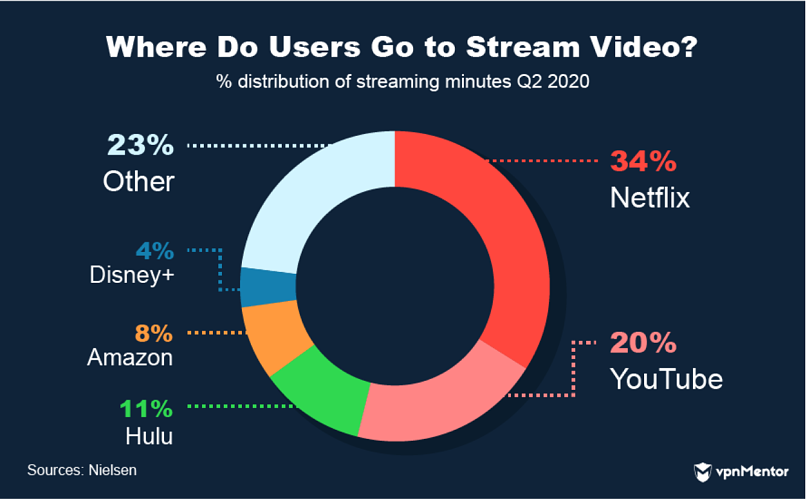
So, COVID-19 contributed to growth for streaming platforms in 2020, but where did users go to get their fix of film, TV, and video?
A study by Nielsen shows that, in the second quarter of 2020, users flocked to 2 streaming platforms in particular. Netflix took up 34% of viewers’ streaming time, and YouTube was the second most popular platform with 20% of all streaming minutes.
Hulu, Disney+, and Amazon Prime account for a little less than a quarter of users’ time. Meanwhile, significant growth in several other platforms demonstrates how the market as a whole has benefitted.
18. People Want Exclusive Content
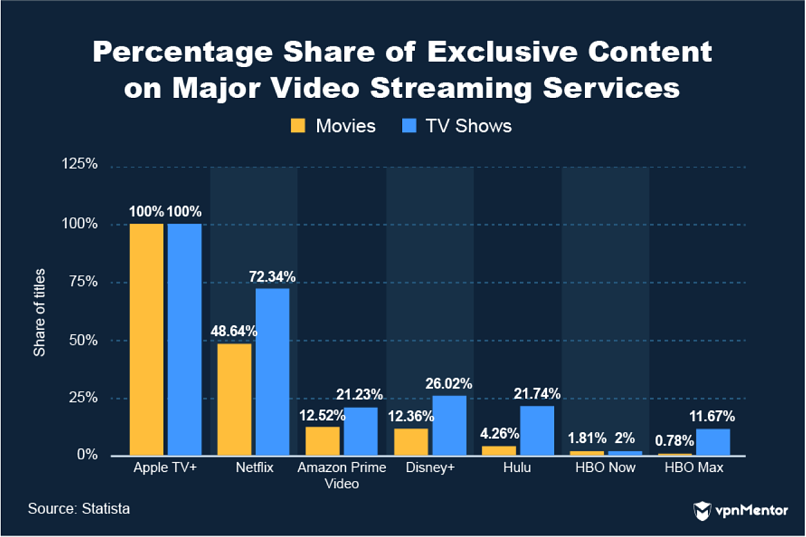
In the context of recent successes, the industry is undergoing something of an “arms race” at this moment in time.
As viewers shift their attention away from TV, online platforms are now battling to secure as much “exclusive content” as they can.
Exclusive content is any content only shown (or licensed to be used) on that single platform. The majority of exclusive content will be original productions by each platform, such as “Netflix Originals,” while other examples may include shows that do not air anywhere else but are made by other production teams.
Video streaming platforms are placing a greater emphasis on exclusive content as they attempt to make their service the most attractive prospect to millions of potential customers.
This is also why video streaming services spend so much on original content, as we shall reveal throughout this section. With more original content, services can differentiate themselves in a fiercely competitive market and gain an advantage over their rivals.
19. Netflix Gets Even Bigger
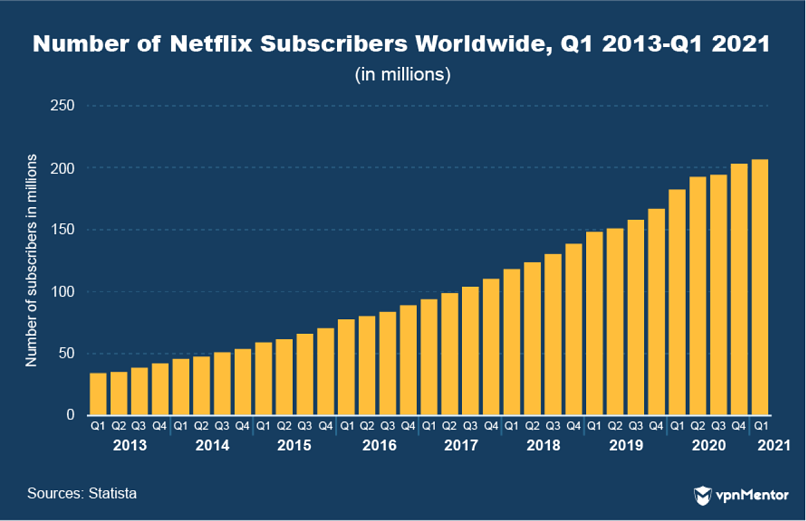
As the most popular online video streaming platform, it should be expected that Netflix’s growth numbers in recent years are the best. Still, that doesn’t make them any less impressive.
In the fourth quarter of 2020 alone, Netflix generated $6 billion of revenue. An increase in revenue of 21.5% compared to the same period in the year before. Netflix would generate total revenue of $25 billion in 2020, with the company valued at $261 billion in September 2021.
Such a staggering financial performance couples a sharp rise in paid subscribers, with Netflix’s total count soaring above 200 million in 2020. In Q2 2020, when lockdowns were implemented worldwide, Netflix’s subscriber count grew by 10 million — a Q2 record for the company.
Netflix users clocked up to 6 billion hours of streamed content per month in 2020. That’s 288GB of data per month, per user.
Netflix’s success is, perhaps, in part, down to the emphasis they place on producing original content. So far, the company has produced over 1,500 titles, winning 430 nominations and 70 awards for Netflix Originals. In total, Netflix spent $17.3 billion on content in 2020.
20. Amazon Prime Is Chasing Netflix
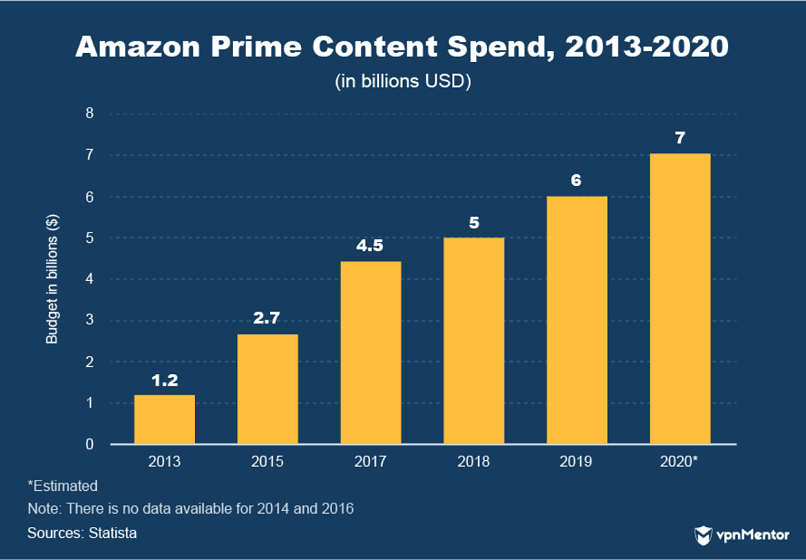
Amazon Prime was launched by Amazon back in 2007, and the global e-commerce store debuted its video service (in some form or another) as early as 2006.
Amazon Prime Video now accompanies the Amazon Prime membership and is a major draw for customers, emerging as one of the main rivals to Netflix in recent years.
Amazon Prime has over 200 million subscribers who pay for premium access to Amazon’s delivery services and video content. Amazon Prime generated $25.21 billion of revenue from its subscription service in 2020, comparable numbers to Netflix.
Prime is trying to get closer to Netflix in terms of the quality and volume of content available on its video streaming platform. That’s why Amazon Prime has spent increasing amounts on video content over the last few years, reaching $7 billion in 2020.
Those numbers still pale compared to Netflix’s $17 billion spend, although Amazon treats its video streaming platform as one smaller segment of a broader e-commerce service.
21. Disney+ Is a Big Mover
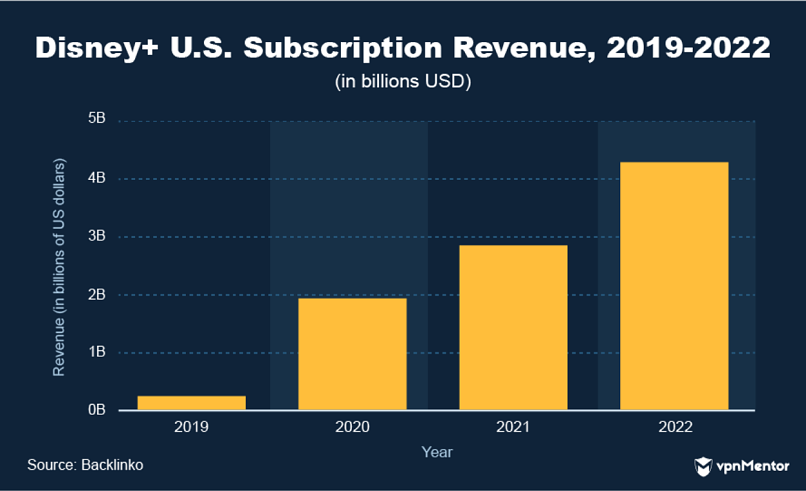
One of the “biggest movers” amongst streaming platforms in recent times is undoubtedly Disney+.
Upon its launch in November 2019, Disney’s video streaming platform generated 10 million subscribers in a single day.
Fast-forward and Disney+ now has 116 million subscribers in 2021, blowing its 4-year goal for subscriptions out of the water in the space of 14 months.
This rapid growth has many experts touting Disney+ as the platform that could provide serious competition to Netflix in years to come. 266 million subscribers are forecasted to hit the platform by 2023.
Those numbers will contribute over $4 billion of subscription revenue in 2022.
Like other platforms, one of the drivers of growth for Disney+ is its focus on original content, and the platform hopes to increase its content spend to $2.4 billion by 2024.
In turn, the unique content on the platform means viewers are sticking around to see what’s next. 78% of Disney+ users retain their subscriptions.
22. Music Streaming Market Share
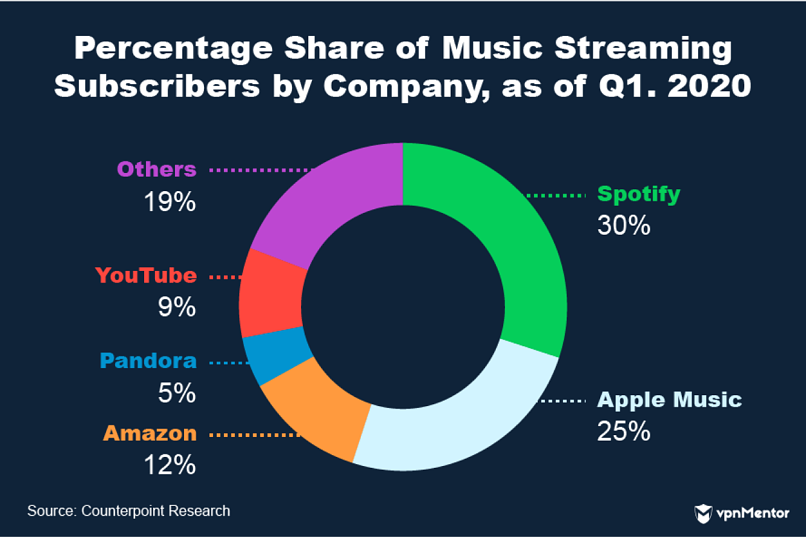
Spotify and Apple Music dominate the music streaming industry, with more than half of all subscribers using at least 1 of the 2 platforms. YouTube also features as one of the biggest platforms, with 9% of all music streaming subscribers, while Pandora (5%) and Amazon (12%) each have a significant user base.
23. Streaming Services & the Music Industry
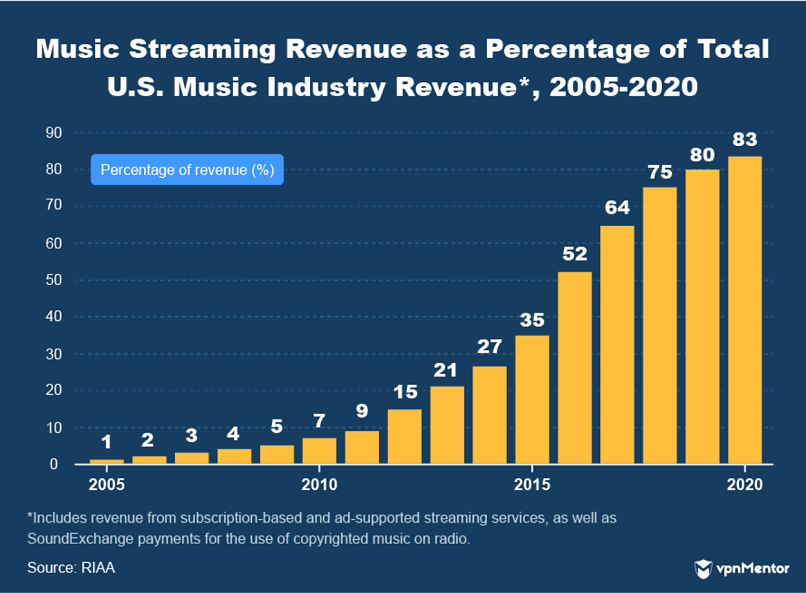
There’s been a lot of discontent coming from artists over the last few years, as growth in streaming services has led to a sharp decline in record sales.
That being said, no one could have predicted that music streaming would become such a crucial lifeline for the music industry in such a short amount of time.
Over the last 9 years, music streaming (including revenue from radio) has gone from accounting for 9% of revenue in the music industry to a staggering 83%. And it’s still rising!
Clearly, the accessibility that streaming provides is too difficult to ignore for many lovers of music.
24. Spotify Continues to Dominate
Spotify has been the number one music streaming platform across almost every metric for a while now, comparable to Netflix’s dominance in the video streaming market.
The service was founded in Sweden in 2006, and the product (as we know it) launched in 2008. Since its introduction, Spotify has grown into an international service available in 79 countries and on all major operating systems.
Part of the platform's success is likely down to its emphasis on discovering new music and emerging artists. 60,000 new songs are added to Spotify every day, and right now, the platform boasts 3 billion playlists, 70 million songs, and over 350 million active monthly users.
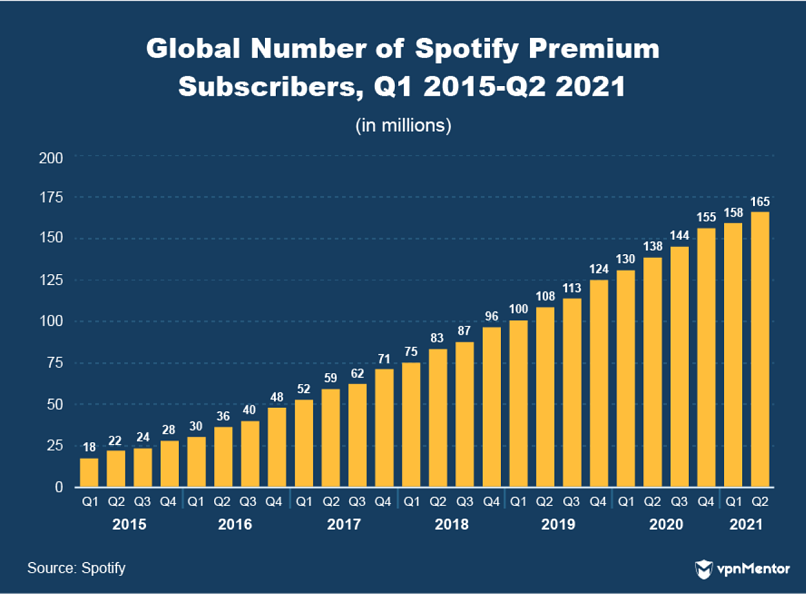
The company saw significant growth over 2020, too, particularly in the fourth quarter as paid subscriptions increased to a whopping 155 million. That’s an 11 million increase from the previous quarter. It generated revenue of over $2.17 billion in this same period. In total, Spotify grossed $9.5 billion of revenue in 2020, an 18% increase from the year before.
25. Apple Music Can’t Match Spotify
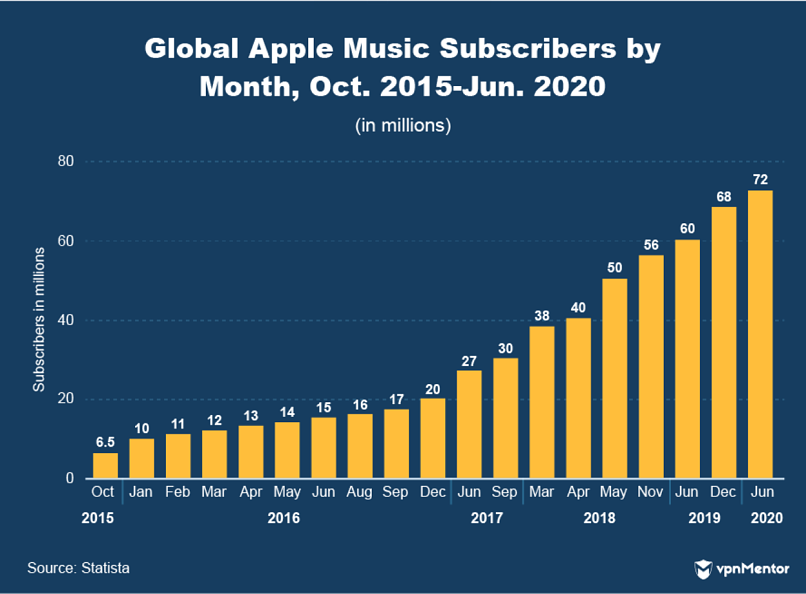
Apple Music launched in 2015 with famous figures like Jimmy Iovine, Eddy Cue, Zane Lowe, and Trent Reznor endorsing what looked set to become a big rival to Spotify’s market domination.
The platform hasn’t really lived up to that potential yet, generating around 72 million paid subscribers by mid-2020 compared to Spotify's 130 million in the same period.
That’s not to say that Apple Music isn’t still thriving from a recent boom across all streaming services.
Apple Music is home to 70 million licensed tracks, and its niche is its greater focus on live, open-air radio presenters instead of playlists and pre-recorded sets. Apple Music’s also available in 167 countries. Considerably more than Spotify's 79.
Apple Music’s plus points contributed $4.1 billion of revenue in 2020, and paid subscribership grew significantly throughout the first half of 2020.
It may come as a surprise to some, but Apple leads the music streaming market share in the USA. Although, Spotify’s popularity elsewhere still means it is growing at a faster rate.
E-Commerce
Along with social media and streaming platforms, e-commerce sites have seen record-breaking numbers across the board.
The growth in this industry is truly remarkable, as people flooded online stores once brick-and-mortar high street shops closed their doors.
Here are some key stats for e-commerce sites in 2021.
26. The Biggest E-Commerce Sites
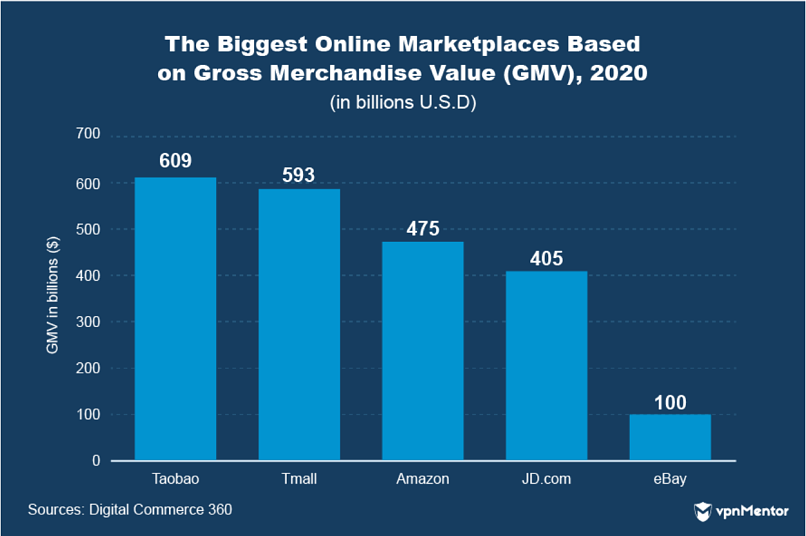
Taobao, Tmall, Amazon, JD.com, and eBay were the top 5 e-commerce marketplaces in 2020.
eBay generated $100 billion worth of sales while just over $400 billion was sold on JD.com.
Amazon had a record year which saw the company become the biggest retailer on the planet. Amazon and its users sold around $475 billion of merchandise in 2020.
Meanwhile, Chinese platforms Taobao and Tmall each had a phenomenal year. Over $1 trillion worth of merchandise was sold through both platforms combined.
27. Mobile E-Commerce is Trending
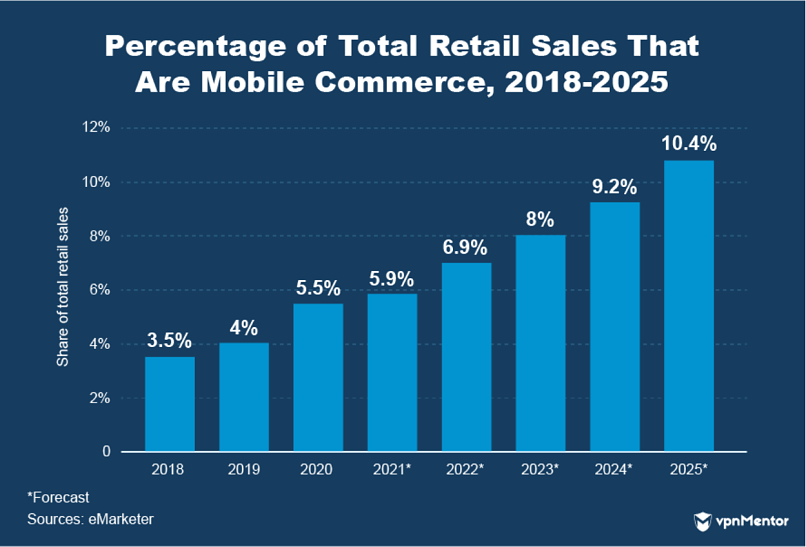
E-commerce finds itself thriving at a time when mobile retail is also gathering momentum. These 2 concepts are intrinsically linked, given that users can’t buy things on their devices without e-commerce sites, while mobile devices make e-commerce sites far more accessible.
On Cyber Monday in 2017, mobile retail hit a record landmark of 2 billion sales. The mobile retail market has only grown in dominance since. 93.5% of internet users have purchased a product online.
Mobile devices now make up most internet connections in 2021, and mobile is expected to realize continued growth over the coming years.
That development should see mobile account for a 10.4% share of all retail sales by 2025. Platforms that cater to mobile users should profit accordingly.
28. A Global Market
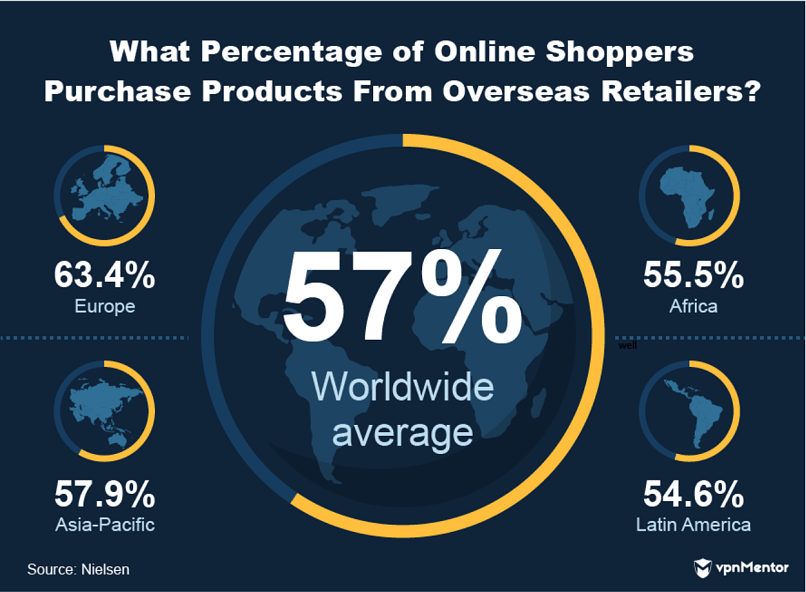
The online world is the perfect signifier for the rise of globalization, and there’s no more far-reaching online industry than e-commerce.
E-commerce allows consumers to view, compare, and purchase products on the other side of the world. There’s no need to take a second suitcase on your holiday, as you can easily import goods from overseas in a matter of days.
A Nielsen study found that 57% of all consumers buy products from overseas retailers. In Europe, this number is as high as 63.4%.
That makes sense, given the close proximity of so many different nations. Still, the numbers show that people are not afraid to order products from the other side of the world when online.
29. Amazon Is King
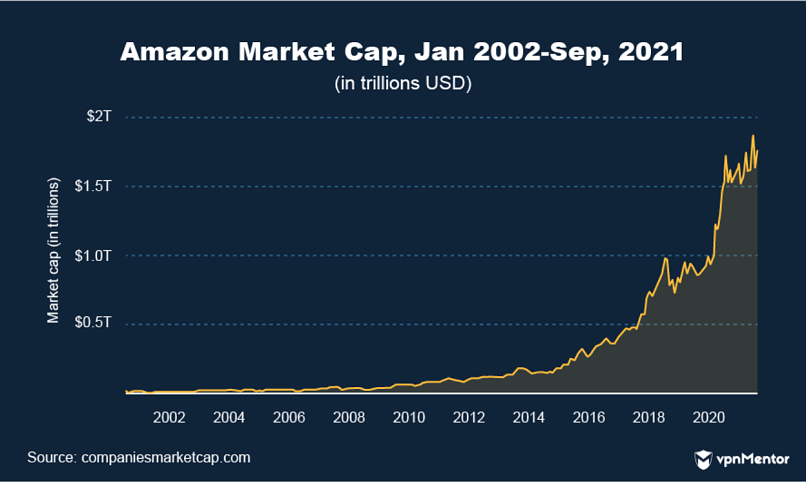
You’ve already seen Amazon Prime, now for some stats on the e-commerce behemoth that is Amazon.
Amazon is listed as the second-largest online company with a market cap of $1.76 trillion in September 2021 — ranking it higher than Tencent, Netflix, and Facebook.
Amazon accounts for 44% of all e-commerce sales. 9/10 consumers check prices on Amazon before purchasing something. The site is home to 12 million products, and the average Amazon Prime shopper spends $1,400 a year on the site.
These crazy stats are typified by Amazon’s performance in recent years. In 2020, Amazon led the e-commerce landscape with $386 billion of revenue, up 38% ($100 billion) from 2019. Net profit rose 84% in 2020 while owner and CEO Jeff Bezos grew his net worth by $75 billion.
30. Shopify Offers Options
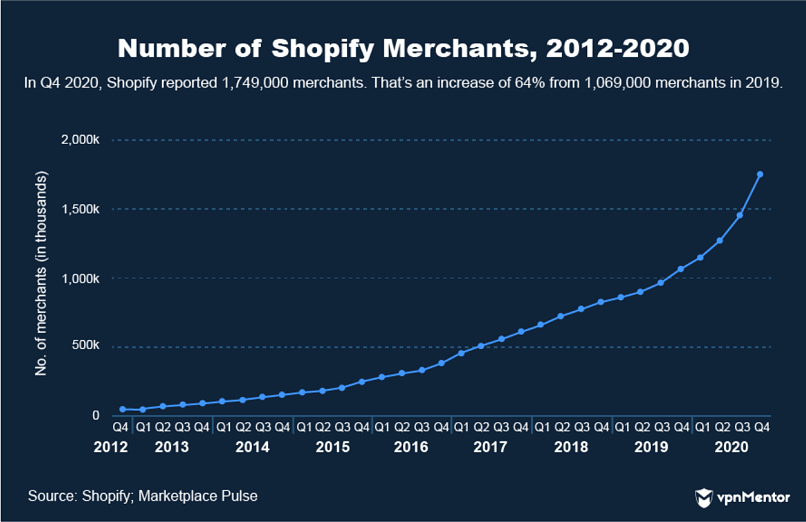
Shopify is one of the leading online rivals to Amazon. Its platform acts more like a website builder for your store, offering over 100 site themes with which users can customize their domain.
Shopify aims to be “the world’s first global retail OS.” Shopify’s array of customization options are contributing to rapid success. There are now over 1 million Shopify stores in 175 countries, while the site saw mammoth growth in revenue in 2020, generating $2.93 billion. That’s an 86% increase in turnover compared to 2019.
At the root of this upturn is Shopify’s prominence as an e-commerce platform for the everyday person. Just about anyone can set up a Shopify store and, in a year where so many people set up an online store, the number of merchants on Shopify grew 54% in 2020 — reaching nearly 457 million in total.
31. Zalando, the Place for Fashion
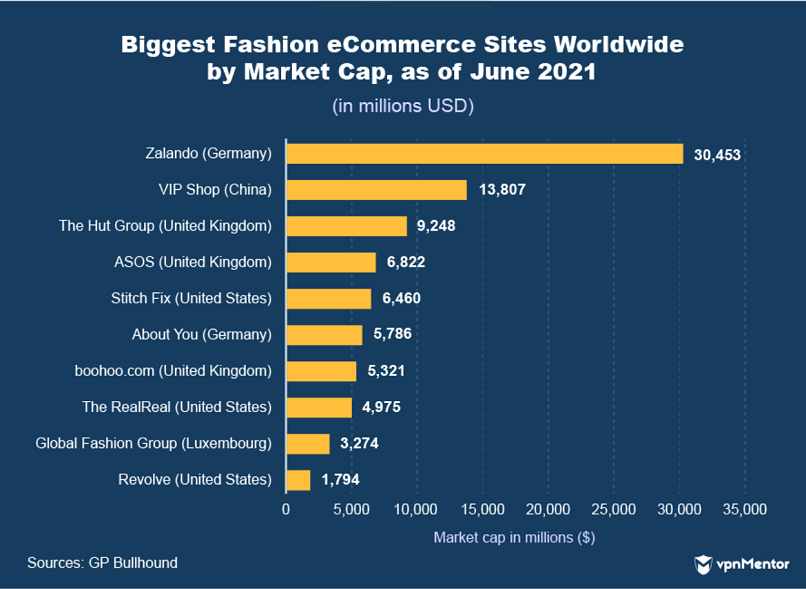
Amazon may dominate the entire market, and Shopify may be the best place to set up your own store, but Zalando is the place people go to buy clothes.
Zalando is a Berlin-based online fashion store founded in 2008 by Robert Gentz and David Schneider. It’s home to over 1,500 brands, delivering 200,000 listed products across 15 different active countries.
The site receives around 730 million visits and 29 million orders per quarter. What’s more, Zalando has seen significant growth recently, posting record revenue of $9.65 billion in 2020, an increase of 23% from the $7.85 billion of revenue it posted in 2019.
32. Pinduoduo Is Huge in China
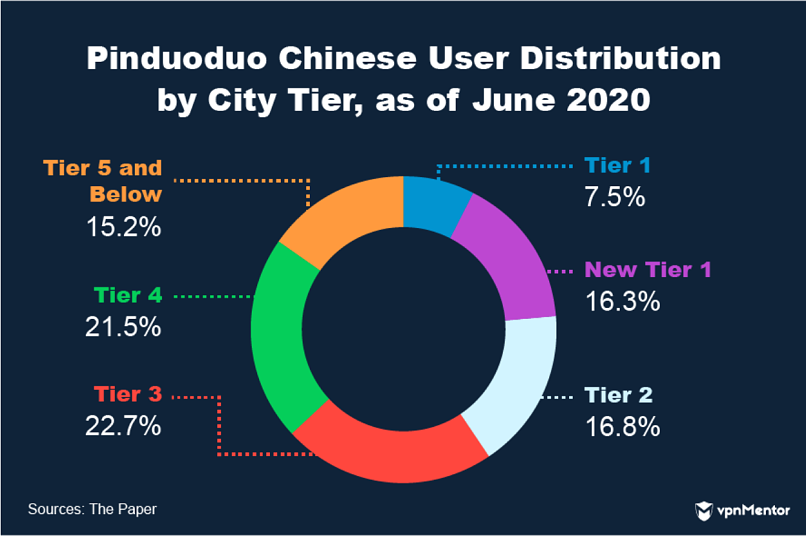
Pinduoduo is a revolutionary new e-commerce site that falls under the banner of “social commerce.”
Founded by Colin Huang in 2015, Pinduoduo’s unique business model promotes group buying by offering users better deals, savings, and coupons if they purchase in a social group (i.e., multiple family and friends buy the same product at the same time).
The company’s motto translates as “together, more savings, more fun,” and the concept has caught on in China.
Pinduoduo’s active user base increased by 50% in 2020, rising to 720 million as more bargain hunters scoured the platform for deals.
36.7% of this user base live in tier 4 or lower Chinese cities. This means Pinduoduo users generally come from lower-income households. The company has been massively successful at targeting this demographic.
Pinduoduo is now one of the leading e-commerce platforms anywhere in the world, generating 60 billion Chinese Yuan in 2020 with a global market share of 4%. That’s enough to rank Pinduoduo as one of the biggest retail brands in the world and the 10th biggest online company.
Travel
Perhaps no industry was hit harder by the global pandemic than global travel.
Stay-at-home orders and international travel bans combined to bring the travel industry to a standstill in April of 2020.
According to the October World Economic Outlook, travel numbers are not expected to rebound to 2019 levels until 2023. Here is the current state of online travel in 2021.
33. Online Travel App Market Share
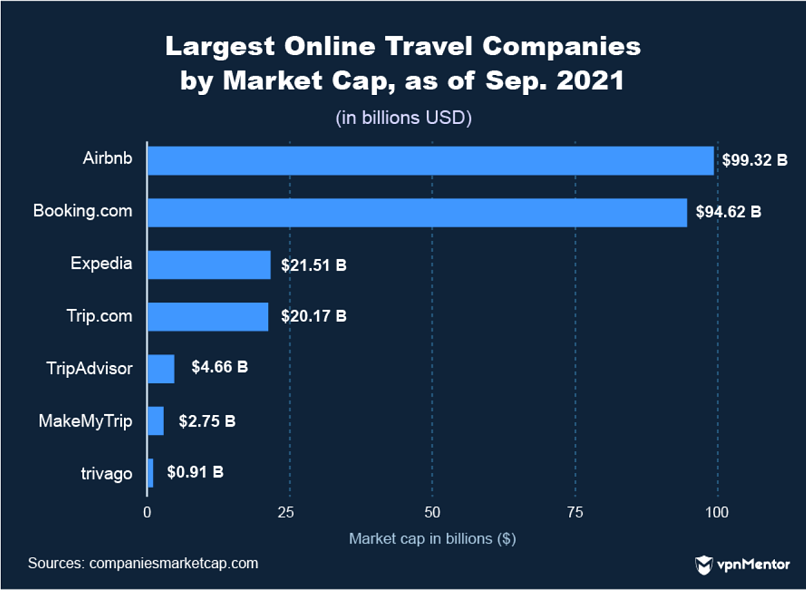
These are the top online travel companies based on their market cap in September 2021.
Booking.com was the biggest online travel company in the world in 2020. Booking.com increased its value to $94 billion in 2021, although this still wasn’t enough to stop Airbnb from becoming the largest online travel company. Airbnb is now worth a whopping $99 billion.
Other apps such as Trip.com, Trivago, and TripAdvisor feature. Also, Expedia – which has risen to become the third biggest online travel company in 2021. Expedia has a market value of $21.5 billion, still some way behind Airbnb and Booking.com.
34. How Do People Make Online Bookings?
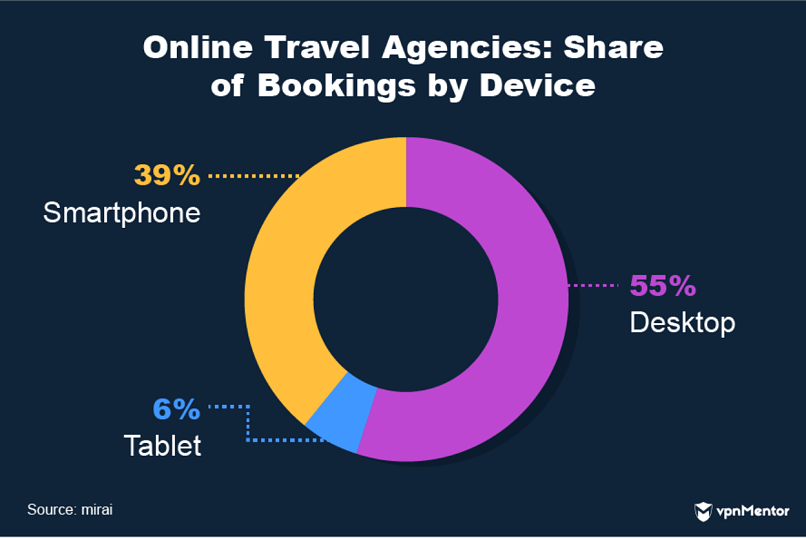
So, how do people usually book their holiday with an online travel agency (OTA)?
Well, research shows that people still prefer to book their holiday via a desktop.
In total, 55% of bookings through OTAs are from a desktop, and 45% come from mobile devices. Mobile is fast becoming the trend for internet use, however, so expect this statistic to change over the next couple of years.
35. Airbnb Loses All Business
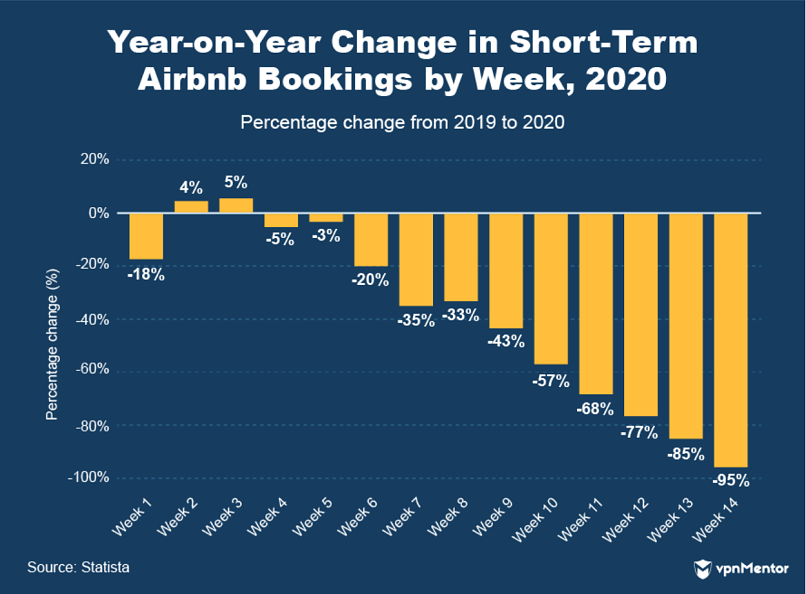
Let's start with one of the biggest online travel companies around: Airbnb.
Airbnb offers users the chance to rent someone else's flat, house, or accommodation for the duration of their stay. Unlike many online travel agencies, Airbnb does not just offer users a selection of hotels and villas; anyone can rent out their accommodation on Airbnb.
The company has seen massive growth since 2014, rising from a value of $10 billion in 2014 to $38 billion in 2019. Though, even Airbnb wasn’t safe from the challenges OTAs faced during COVID-19; its valuation fell to $18 billion in 2020, a 53% decrease in value.
The reasons behind such a sharp fall in valuation are evident in the number of bookings Airbnb took throughout the first 14 weeks of 2020. The company experienced a 95% decrease in bookings following the imposition of lockdowns.
Revenue was badly damaged for Airbnb throughout 2020. Its $3.4 billion turnover represented a 30% decrease from the year before.
36. No Bookings for Booking.com
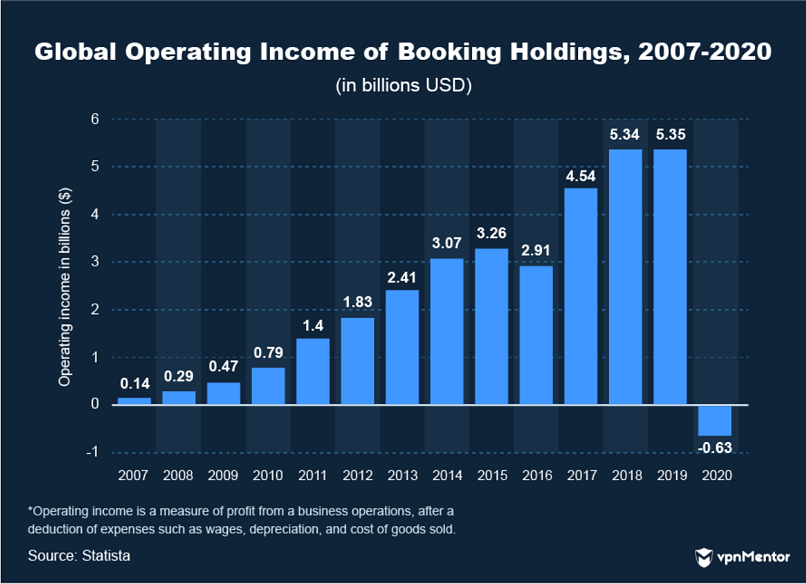
Booking Holdings experienced a similarly difficult 2020.
Booking Holdings is the parent company behind travel giant Booking.com, as well as other sites like Kayak, Priceline, and Agoda.
Booking Holdings’ gross travel bookings plummeted 63% from the previous year in 2020. Total room nights dropped from 844 million in 2019 to 489.5 million in 2020, a decline of 58%.
Booking Holdings’ performance had been steadily rising for several years before 2020, and the company achieved a record take-home operating income of $5.35 billion in 2019. But Booking Holdings (and all of its associated services) would suffer horribly in a tumultuous 2020.
The company posted awful figures in 2020, digging into the coffers to balance the books on a $630 million loss. That’s a $6 billion difference from the year before.
37. Trip.com Begins Recovery
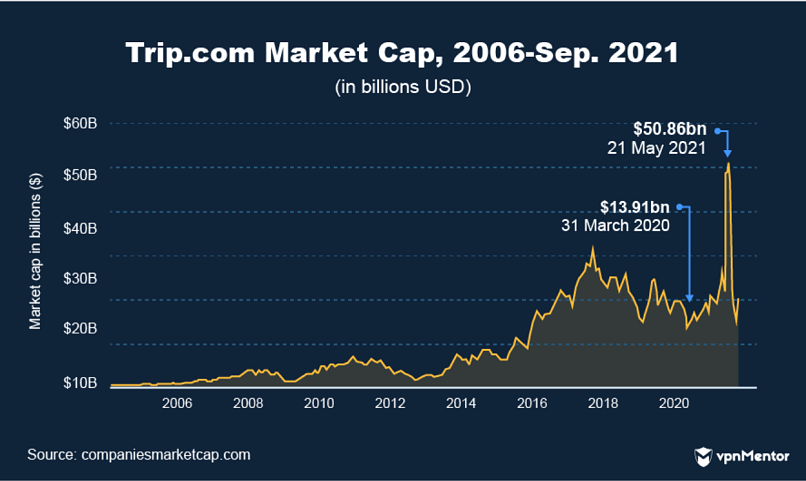
Trip.com is a Chinese online travel provider, allowing users to reserve accommodation, organize transportation, and explore other holiday packages and in-destination services.
Like every other online travel company, Trip.com saw huge losses in 2020. Net revenue went down to $2.8 billion, a 49% decrease from the figures Trip posted in 2019.
Accommodation reservations accounted for 39% of Trip.com’s revenue in 2020. The loss in revenue from this side of the business was significant; it fell 47% in 2020 to $1.1 billion.
Significant revenue losses resulted in Trip.com’s lowest valuation in years. The Chinese company had a market cap of $13.91 billion at the beginning of lockdown in 2020.
However, Trip.com (and many other online travel companies) are now experiencing a recovery from the COVID-19 pandemic. Trip.com’s statistics are starker than most. The company rose to an all-time high valuation of $50 billion in May 2021, a little more than a year after its depreciation.
While this valuation has since fallen, it’s clear that the brand is well on its way to recovery with steady progress in 2021.
Remote Work
Remote working platforms and apps were forecasted to see massive growth, even before the events of 2020.
Since then, online remote work services have exceeded any expectations as workers were forced out of the office, and many others looked for extra money to cover their bills during the pandemic.
38. Freelancing Apps: User Base Comparison
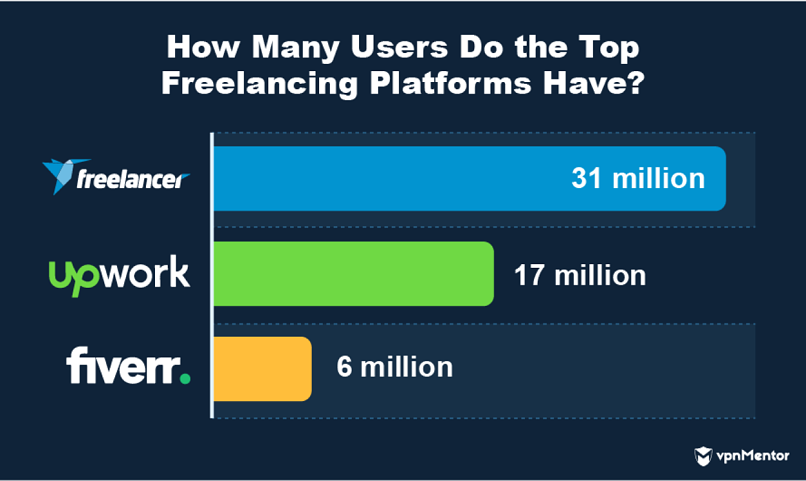
A look at the 3 biggest freelancing platforms shows us where users will make some extra cash.
Overall, the gig economy saw a 33% increase in participation throughout 2020. Gig workers made a collective $1.7 trillion – a 29% increase from 2019 ($1.2 trillion).
More people are freelancing online, with plenty of work to go around, as many industries have begun hiring remote workers.
A fantastic 2021 seems to have set the wheels in motion for a prosperous future in the gig economy. 78% of people who freelanced in 2021 said they plan to do the same or more gig work in 2021.
39. Fiverr Attracts Buyers

Fiverr is a freelancing website founded in 2020 by Micha Kaufman. The website allows businesses (buyers) to hire freelancers (sellers) to provide services across several industries.
Typical freelancing roles such as graphic design, writing, and web development make up most jobs posted to the platform.
Despite being the third-largest gig economy platform in terms of user-base, Fiverr is considered more valuable than Upwork or Freelancer. Fiverr has a market cap of around $6.6 billion.
People have flooded online to make money during the COVID-19 pandemic, which means (just like Shopify) Fiverr attracted a wave of buyers and sellers in 2020. In total, there are now 3.42 million active buyers, and sellers are providing services across more than 500 different categories.
55% of Fiverr’s revenue comes from repeat buyers, which explains how the recent influx of businesses on the site could equate to such phenomenal revenue growth.
The gross merchandise value of Fiverr grew to nearly $700m in 2020, an increase of 74.39% on the year before. Meanwhile, revenue grew by 77%, rising from a little over $100 million to $189.5 million.
40. Collaboration App Market Growth

Social and collaboration software companies have experienced staggering growth since the onset of COVID-19 and remote work.
Apps like Slack, Microsoft Teams, Zoom, and Asana have become necessary for businesses trying to manage workflows and keep in close contact during the pandemic. The collaboration software market reached $3.8 billion in 2020. 2021 should be an even better year for the sector with $4.5 billion of forecasted revenue.
41. Zoom Revenue Increases 700%
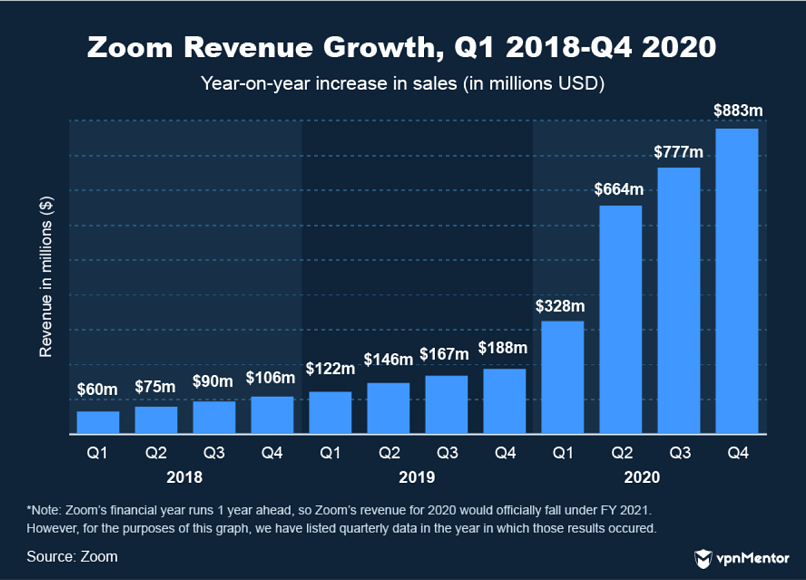
Zoom is undoubtedly one of the biggest winners in the collaboration software market. The conference call platform enjoyed a breakout 2020, which saw the company become the 16th biggest online brand in 2021.
Its users logged 3.3 trillion meeting minutes in 2020, up from less than 10 million annual meeting minutes in 2019. The platform grew by 300 million new users in April 2020, as many industries moved their operations online.
The crazy numbers from Zoom’s 2020 keep coming. The app was downloaded, on average, 2.13 million times every day in 2020 for a total of 485 million downloads. In the last quarter of the year, the company’s performance was 400% greater than in the same period in 2019.
Overall, Zoom generated $2.652 billion in revenue in 2020. An enormous increase of 702% from 2019. Zoom may be the biggest mover on this list.
42. Picking Up the Slack
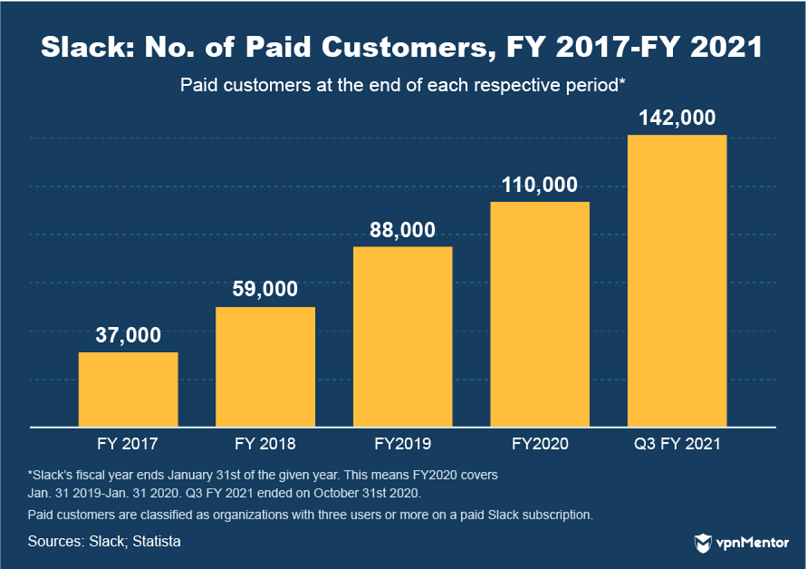
Slack is a corporate messaging app that was realized as a business venture by accident back in 2009. Originally, the platform was designed as a communication tool between 2 colleagues, though the app has seen significant development since then.
Slack currently has more than 12 million active users and 140,000 paid corporate users. The company has grown from a $7 billion market cap in 2018 to a value of more than $20 billion in 2020. In September 2021, Slack’s value hit an all-time high of $26.5 billion.
People really like Slack, which is why the platform’s upward trajectory is expected to continue. According to industry estimates, Slack’s active monthly user base could reach 79 million by 2025.
43. Twilio Stocks Rise
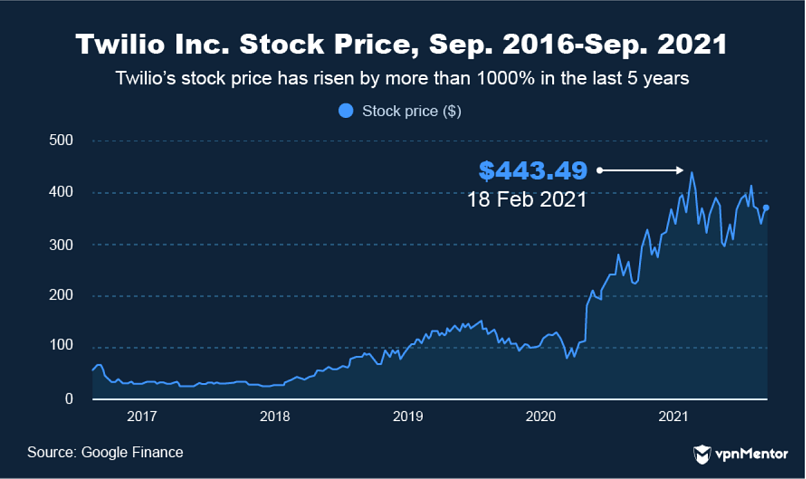
Twilio is niche compared to Slack. The app serves a similar purpose, except it is tailor-made for software developers who want to send and receive communications programmatically.
The app saw a similar boom in 2020 compared to many other work collaboration platforms. Twilio’s user base grew from 179,000 to 220,000 in late December 2020, generating $1.75 billion in revenue.
Most notably, Twilio’s gains could be seen in its share price, which rose from $80 in April 2020 to $338.50 by the end of the year. The share price remains on a generally upward trajectory, too, reaching $443.49 in mid-February 2021.
Ride-Sharing & Delivery
Ride-sharing and delivery are 2 similar industries with contrasting fortunes.
Ride-sharing fell into insignificance during the travel bans of early 2020, and even the most adaptable companies posted losses in revenue throughout the financial year.
Delivery, on the other hand, had its best year yet. A boom in food delivery app usage has placed the entire market on an upward trajectory.
44. Future Market Growth for Ride-Sharing
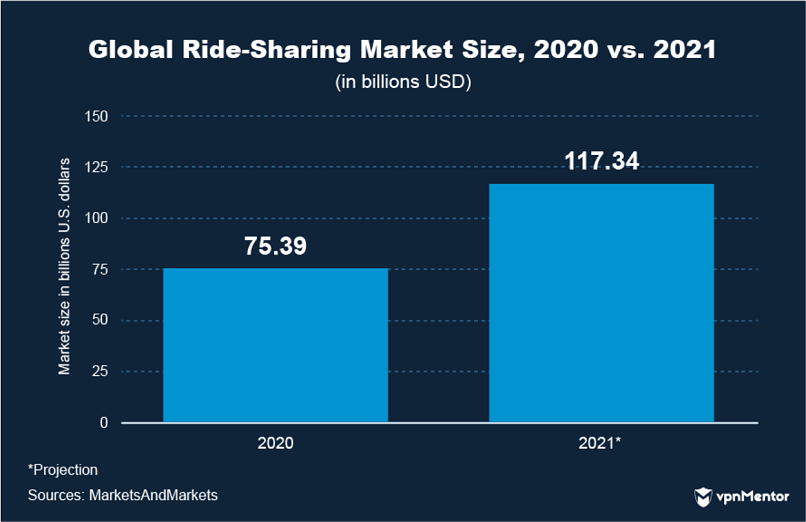
Following a tumultuous year, ride-sharing services turned over a collective $75 billion in 2020.
The biggest players in the U.S. market are, as always, Uber and Lyft. Uber dominates with around 68% of the U.S. market, while Lyft commands roughly 32% of ride-sharing sales.
China’s only ride-sharing service “DiDi” has 377 million active users and holds 90% of the nation’s market. However, data protection concerns currently threaten to derail DiDi’s momentum; Chinese regulators recently removed the app from several app stores, plunging China’s ride-hailing industry into disarray.
Elsewhere, things are looking up for ride-sharing companies in general. The market is expected to reach over $115 billion by the end of 2021.
45. Lyft Struggles During COVID-19
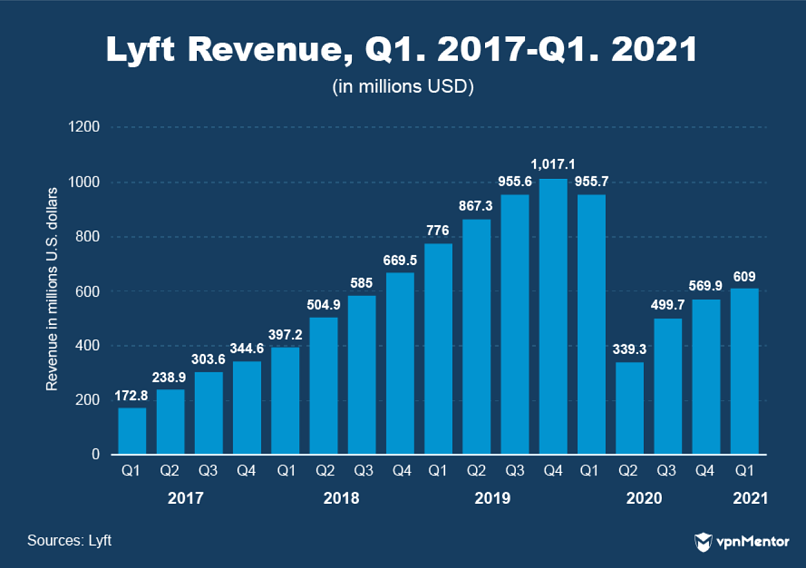
A look at Lyft’s quarterly revenue demonstrates a typical pattern for ride-sharing and ride-hailing apps in 2020.
There aren’t too many online companies that have faltered recently, but services like Lyft certainly rank amongst them. Founded in 2012, the peer-to-peer transportation service struggled as COVID-19 lockdown diminished the need for transportation and ride-sharing. It experienced a $616 million drop in revenue in Q2 2020, and fell from a valuation of $14.4 billion in January 2020 to a value of $7.1 billion in October 2020.
The company is still impressively far-reaching, though. It’s active in 644 towns and cities across America, and Lyft drivers still managed to clock up $1.1 billion in tips throughout 2020.
It’s also more than recovered since, rising to $15.7 billion in December of the same year and eventually topping out at a $21.7 billion valuation in March 2021.
46. The Two Sides of Uber
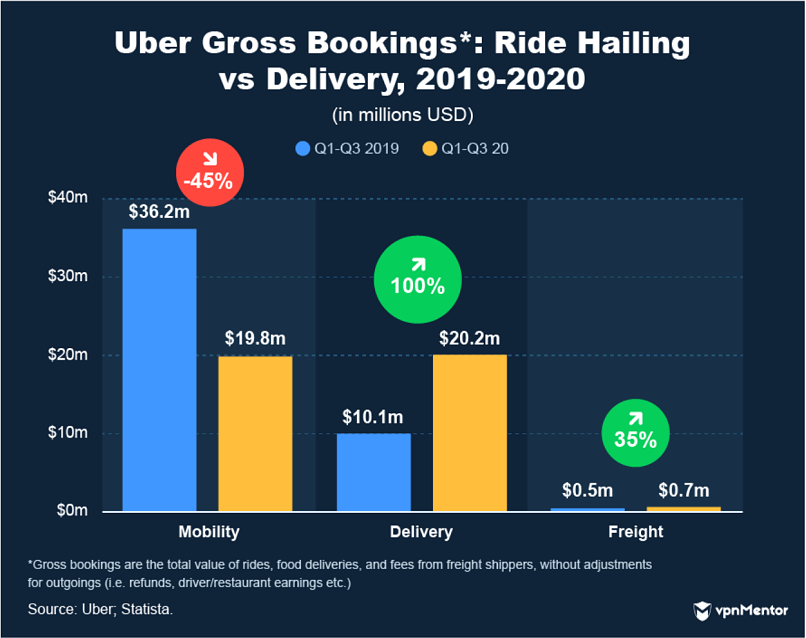
Uber has had mixed fortunes of late, owing to its unique position as both a ride-sharing and food/freight delivery service.
Ride-hailing has suffered terribly, whereas food delivery apps have enjoyed their best period. Uber is placed at this crossroads, so one side of the business has done its best to balance the other in 2020 effectively.
While ride bookings fell by 38%, food delivery bookings through Uber Eats rose by 166%. Revenue for food bookings tripled in the second quarter of 2020 compared to the previous year and grew 28% from the previous quarter to $1.7 billion.
Through the first 3 quarters of 2020, Uber food delivery and freight revenues grew by 100% and 35%, respectively, whereas mobility revenue fell by 45%.
However, Uber’s outstanding performance in food delivery was ultimately unable to balance the books, as revenue fell from $14.1 billion in 2019 to $11.1 billion in 2020 — a drop of 21%.
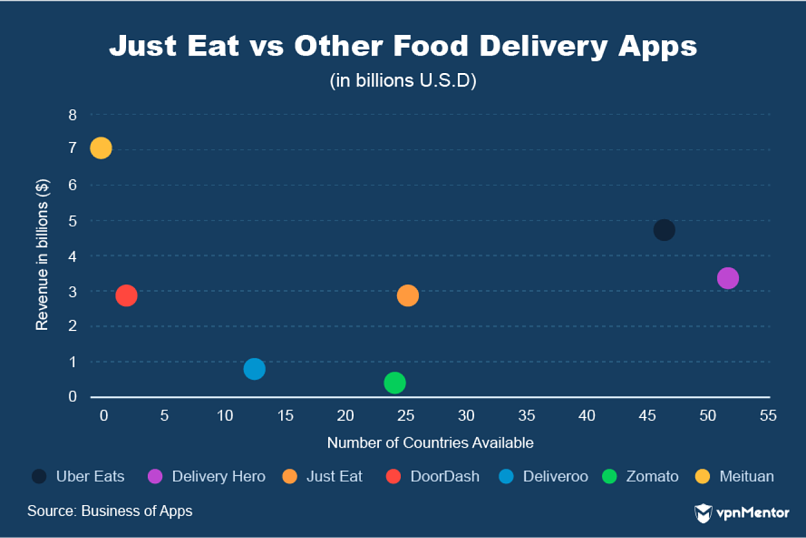
47. Food Delivery Apps in China, EU, & the U.S.
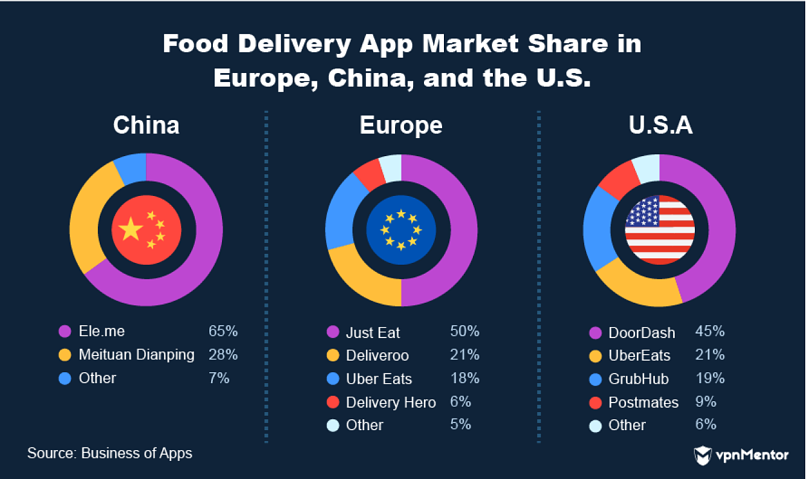
Food delivery is a hyper-competitive market right now, as recent industry growth has promoted fierce competition and a range of different food delivery services.
Strangely, a different food delivery service dominates country by country, and the same can be said from one region to the next.
In the United Kingdom and the EU, Just Eat is far-and-away the prevailing service, commanding 50% of the entire market. Uber Eats pales in comparison in Europe, yet in the U.S., Uber Eats is the second most popular app in a tightly contested market.
DoorDash is the biggest food delivery app in the United States and has a market share of 45%.
In China, a completely different cast of services makes up the market. Baidu is featured as the 18th most valuable online company, yet its food delivery app has the lowest market share of the primary candidates.
Meituan’s app is by far the biggest in China, with a market share of 65%.
48. Food App Market Size Forecast
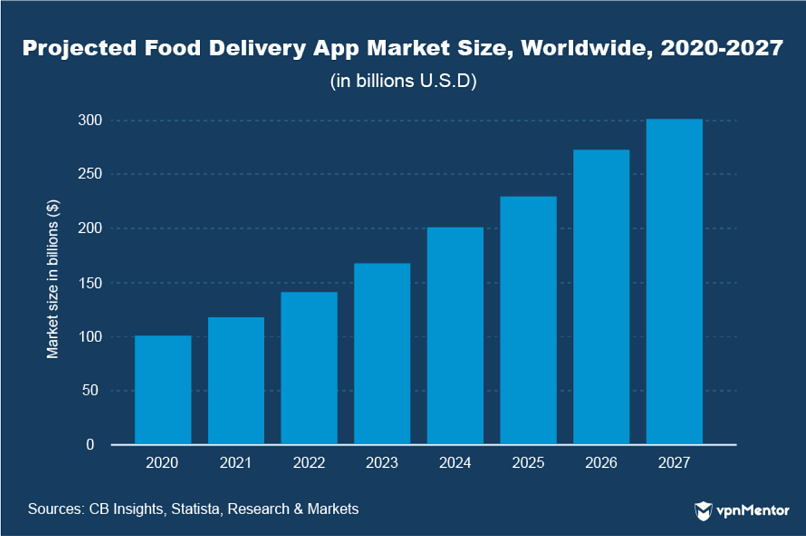
The COVID-19 pandemic has accelerated the development of the food delivery app market.
Food apps are expected to see 300% growth from 2020 to 2027, eventually reaching a value of $300 billion in the next 6 years.
That’s pretty impressive growth. It demonstrates somewhat of a turning point in the takeaway business, as restaurants and kitchens move away from in-house dining to centralized, front-door delivery service platforms.
49. DoorDash on an Upward Trajectory
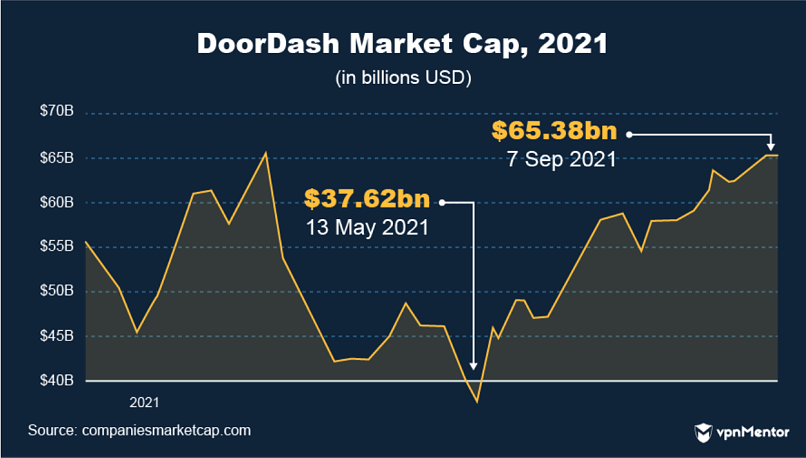
The biggest player amongst food delivery services in America is DoorDash.
DoorDash posted record revenue of $2.9 billion in 2020, a 241% increase from 2019. The U.S. app decreased its losses from $667 million to $461 million, and added 8 million users in a marquee year.
Its success was partly down to an aggressive acquisition strategy. The app added 390,000 new restaurants to its service — some of which were added to DoorDash without the permission of restaurant owners.
The app’s popularity meant it entered the market with a massive $72 billion valuation in late 2020. This was “ridiculous” to some as many felt the success of DoorDash was primarily attributed to the COVID-19 pandemic.
Despite record numbers, DoorDash’s aggressive strategy and overall outlay meant it failed to register a profit in 2020. In fact, the app has failed to turn revenue into profit throughout a full fiscal year in the entirety of its lifetime.
Nonetheless, the company has seen its valuation climb after a massive drop in May 2021. A large portion of that drop in value was caused by a sell-off. DoorDash is now valued at a whopping $65.38 billion, and all signs point toward it making continued progress into the future.
50. Just Eat Vs Competitors
Just Eat was launched in Denmark in 2001 and moved to London’s Docklands area soon after its creation. The owners wanted to take advantage of the UK’s thriving food delivery market, which accounts for 50% of the entire market within the EU.
The Just Eat service generated £7,000 a month in its first 6 months, charging 10-15% commission for every order.
Since then, Just Eat has grown into a dominant food delivery brand. It completed a merger with takeaway.com in early 2020 to take greater control of the European market and eventually saw £2.1 billion in revenue in 2020. That’s a 61% increase from 2019.
Just Eat’s 38 million users grew to 60 million in 2020, while total orders swelled from 286 million in 2019 to 588 million in 2020. Total restaurants on the platform grew from 185,000 in 2019 to 244,000 in 2020, and the app also expanded its service to 23 countries.
So, 2020 was a pretty good year all around for Just Eat. This huge performance was enough to bring it closely behind Uber Eats as one of the top food delivery services worldwide.
Various Other Industries
There are millions of internet companies across countless industries, so there’s no way we could squeeze every player onto this list.
Nonetheless, here are a few more companies from other industries that have made it big.
51. PayPal Sees Record Profit
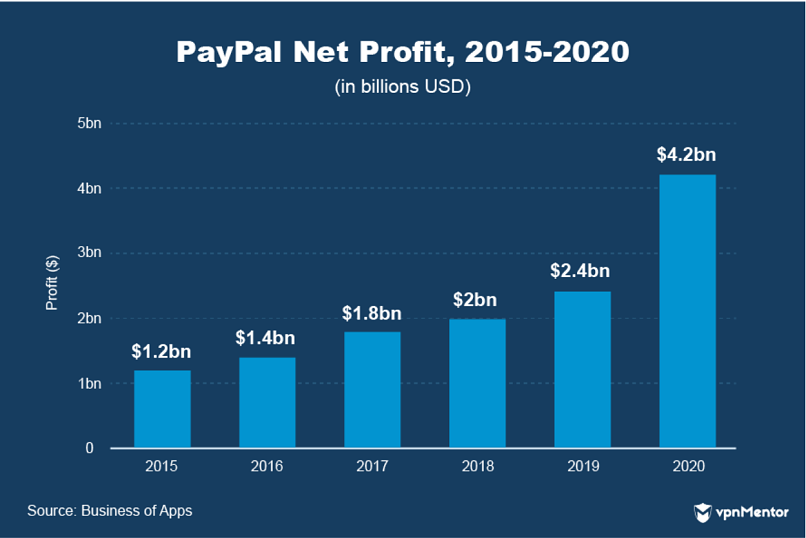
PayPal was one of the first payment solutions that tried to fix online transactions. Though the platform has missed opportunities for further growth over the years, it is now seeing record performance.
After big acquisitions, namely iZettle ($2.2 billion) and Honey ($4 billion), PayPal entered 2020 with momentum. The ensuing emphasis on online payments and e-commerce during COVID-19 has propelled the platform into new territory.
That’s not only in the form of revenue, either. PayPal is now turning big revenues into massive profits. Revenue rose by 20.9% in 2020 to $21.4 billion. Net profit, meanwhile, rose to $4.2 billion in 2020. That’s an increase of 75% from the year before.
The e-commerce boom meant PayPal merchants grew from 305 million to 377 million, with 87.5% of online buyers using the PayPal service throughout the year.
52. Coinbase Profits from Crypto Boom
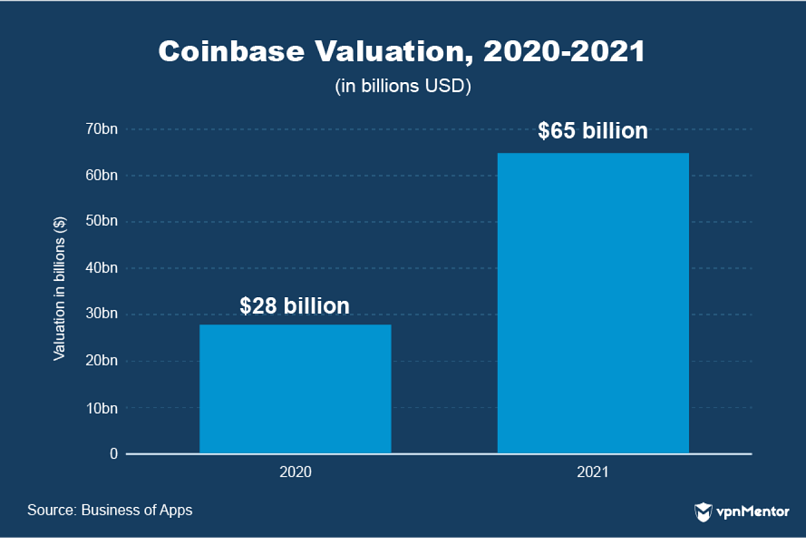
This wouldn’t be an article about the growth of online markets if we didn’t mention cryptocurrency.
Coinbase has been the leading crypto-exchange platform since 2012. For this reason, it’s been the biggest beneficiary of a recent rise in cryptocurrency value.
The monthly trading volume of cryptocurrency surged in early 2020, rising from $800 billion in January to $1200 billion in February. Bitcoin alone increased in value from around $6,000 to $40,000, explaining Coinbase’s success early in the same year. In the second quarter of 2020, Coinbase’s revenue increased from $585 million to $1.14 billion.
The number of users on the platform nearly doubled throughout 2020 from 30 million to 56 million, while Coinbase’s valuation increased by 132%.
53. Match Group Monopoly
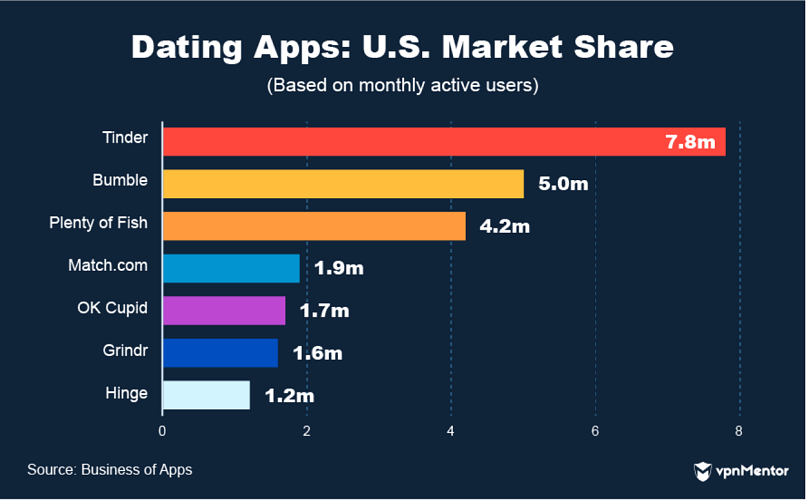
These are all of the prevailing dating apps in the U.S. market. Now, what if I told you that Match Group owns all but 2 of them?
That’s correct. Match Group owns Tinder, Match, OkCupid, Hinge, Chemistry, Plenty Of Fish, Meetic, Twoo, and People Media. In fact, the group’s monopoly consists of 45+ dating services in total. Bumble and Grindr are the only 2 major apps not within its management.
Given this extensive range of dating services, Match Group stood to make more money than most as home-bound individuals surged onto online dating services in 2020. A massive increase in revenue coincided with a massive increase in users of Match’s services.
In 2020, revenue rose to $2.4 billion, up from $2 billion in 2019. Across 2020, Match’s paid user base increased from 9.8 million in Q4 2019 to over 10.9 million paid users by the end of 2020.
Revenue data shows that people jumped on dating apps after lockdowns were eased, too. Q3 revenues increased by 15% compared to the second quarter of 2020.
54. Teladoc Health Provides Guidance
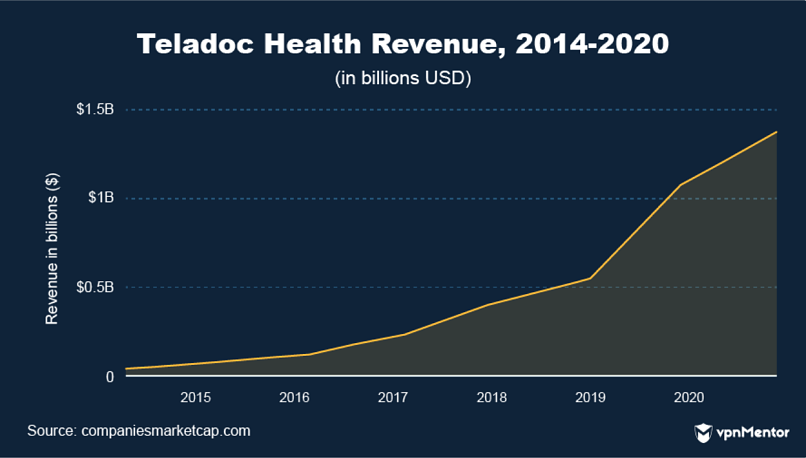
Teladoc Health is the 54th largest internet company based on a market cap valuation of $23.02 billion in September 2021.
Teladoc Health operates within a novel and emerging subsector of the healthcare industry. The field of telehealth has experienced substantial expansion throughout 2020, with individuals increasingly turning to remote medical consultations to receive guidance and care from the comfort and security of their own homes.
Throughout the first 9 months of 2020, 7.6 million people used the Teladoc Health platform. That’s a 163% increase in user base compared to the previous year. In the third quarter of 2020 alone, visits to Teladoc Health rose by 2.6 million, a 206% year-on-year increase.
Teladoc Health looks as though it has been the main beneficiary of the telehealth industry’s rise. In the third quarter of 2020, Teledoc posted $288.8 million of revenue, increasing 109% in 2019.
Overall, Teladoc Health has prospered recently, posting a record revenue of $1 billion in 2020.
Conclusion
The online industry has generally thrived in 2020, and the trend looks set to continue heading into 2021.
Some industries have struggled, though. In many ways, online sectors like travel and ride-sharing have been desperately unlucky.
No one could have predicted the unfortunate events of 2020. It just so happened that the virus was extremely transmissible, and movement from place to place was to be strictly limited.
This is not normal, of course, and struggling industries look as though they will be back in business sooner rather than later.
As for the winners, these internet companies have been launched into unparalleled levels of success. Surely now the business world’s transition online is already well underway!
About the Author
Tom Read is a Content Manager for vpnMentor who loves to research, edit, and write informative articles about privacy and cybersecurity. His work includes a guide to supporting BLM safely online and a statistical breakdown of crime in US schools.


Please, comment on how to improve this article. Your feedback matters!