Honeypot Research: A Data Breach Analysis


Over the course of a year, vpnMentor deployed a honeypot of open servers containing fake personal data to lure outside actors, analyze their behavior, and record what happens once a server is left open without encryption or other safeguards. This gave us near-real-time data on hackers' activity, allowing us to have a front-row view of a data breach in action and monitor events as they unfold.
Data breaches happen when sensitive, confidential, or proprietary files and documents are accessed by or disclosed to unauthorized individuals or groups. Breaches may occur when external actors intentionally infiltrate private databases or networks. Some common ways hackers steal information are brute force attacks, malware introduction, and phishing.
Similarly, servers left vulnerable become accessible to external actors, both ethical and malicious. Often, these are the cases we discover and publish about. This is also the focus of our research.
According to Verizon’s 2022 Data Breach Investigations Report (DBIR), human-related errors accounted for 13% of data breaches in recent years, with cloud storage misconfiguration being one of the most prevalent examples. This figure is substantial enough that enterprises and small and midsize businesses (SMBs) rank human negligence as one of the most significant security issues they encounter, as reported in Kaspersky’s global survey of organizations’ information technology (IT) managers.
Analyzing data breach patterns, vulnerabilities, and effects is thus crucial for identifying weaknesses and assessing risks that may lead to compromised sensitive or confidential information. Similarly, it improves data management systems, allowing essential personnel to effectively handle emergency incident response.
Given the prevalence of human-error-related data breaches, we sought to gather further insight into their various aspects by creating a honeypot and monitoring the data from the experiment in real time.
Goals and Methodology
Typically, honeypots are unprotected networks, databases, or systems used to divert cyber attackers from legitimate sensitive assets. However, in this case, our honeypot served to attract outside actors and gather crucial information on data breach trends. Specifically, we wanted to test the exposure factor and the discoverability of sensitive files stored in the cloud.
We aimed to determine how fast an exposed database can be located depending on different settings and identify which database types are more susceptible to being found. We also hoped to establish the geographical location of most outside actors (assuming they are using a VPN server close to their region) and record the percentage of ethical hackers willing to disclose the leaks.
Thus, we deployed a honeypot of various unprotected and unencrypted storage servers with fake user data that would enable us to observe the behavior and tactics of outside actors and hackers in a simulated environment. The experiment lasted 450 days, from April 29, 2021 to July 14, 2022. Here are its key components:
Website
We created the honeypot behind a credible-looking website of a fake fraud prevention company. We selected this industry because of its potential appeal to hackers seeking confidential and sensitive information.
We also wanted to allow hackers to find the company’s owner and potentially proceed to responsible disclosure. Thus, we included a Contact page listing a functional email address that our researchers monitored.
Servers
We created a total of 14 Amazon AWS S3 buckets, 1 Google Cloud Storage server, and 1 Azure Blob Storage server. We limited the Google and Azure servers because we expected outside actors to merely reuse and modify tools focused on AWS S3 buckets to work with Google and Azure servers. This scenario would yield no measurable difference in the data and results.
We wanted to have multiple S3 buckets to comprehensively test the discoverability of related buckets, depending on the different keywords, suffixes, and prefixes they contained. As most server discovery tools focus on AWS S3 buckets, having many buckets also allowed us to observe and record which discovery tools hackers used.
The main S3 bucket was directly connected to the website. It contained images hotlinked from the website and fabricated user data:
- [website].s3.amazonaws.com
Meanwhile, the Google Cloud Storage and Azure Blob Storage servers had the website name (similar to the company name) with no suffixes or prefixes. We created the following to see if actors who could find the main S3 bucket would check other storage services for the same server names:
- [website].storage.googleapis.com
- [website].blob.core.windows.net
Only one of the exposed S3 buckets did not contain the website name and only had an easy-to-find keyword:
- invoices-up.s3.amazonaws.com
The remaining 12 buckets contained the company name and a generic prefix/suffix.
Two used the most common suffixes checked by every S3 finder tool and were considered the control bucket names:
- [website]-dev.s3.amazonaws.com
- [website]-staging.s3.amazonaws.com
The other 10 had prefixes/suffixes handpicked from various S3 bucket finder software:
- s3finder: [website]-troposphere
- bucket-stream: [website]_teamcity
- goGetBucket: internal-tools-[website].com
- s3recon: [website].com_stg
- s3-open-bucket-finder: [website]-s3-connector-test
- AWSBucketDump: [website].com-www.t
- PyLazyS3: files-attachments-[website]
- insp3ctor: [website]-internal-dist
- s3enum: [website]-marketing_assets
- amass: webdisk.billing-[website]
In the list above, the items bolded refer to the discovery tools. Most of these tools have hardcoded prefix and suffix lists that they combine with an input keyword. To find existing buckets, they try different combinations of these prefixes and suffixes along with the keyword. We selected bucket names that were only discoverable through one of the tools.
For instance, the bucket name with the suffix “troposphere” ([website]-troposphere) could only be found or generated using the suffix list from s3finder. This means none of the other tools returned bucket names with that suffix. Thus, the discovery of this bucket would mean that an outside actor most likely used s3finder to find this specific vulnerable server.
The main S3 bucket contained fake sensitive user data we would use to analyze the patterns of attackers. The remaining, non-primary buckets had negligible data and were only created to track whether hackers would follow the breadcrumb trail.
We operated under the following assumptions:
- A malicious actor could use brute forcing (automated trial and error to find bucket names) to discover the only bucket without the website name.
- A malicious actor could automate bucket discovery by scraping websites and finding images that were linked from servers and then scanning them.
- An outside actor who could find the main S3 bucket could follow the breadcrumb trail (hotlinked images) and run other tools to find the related secondary servers.
Fake User Data
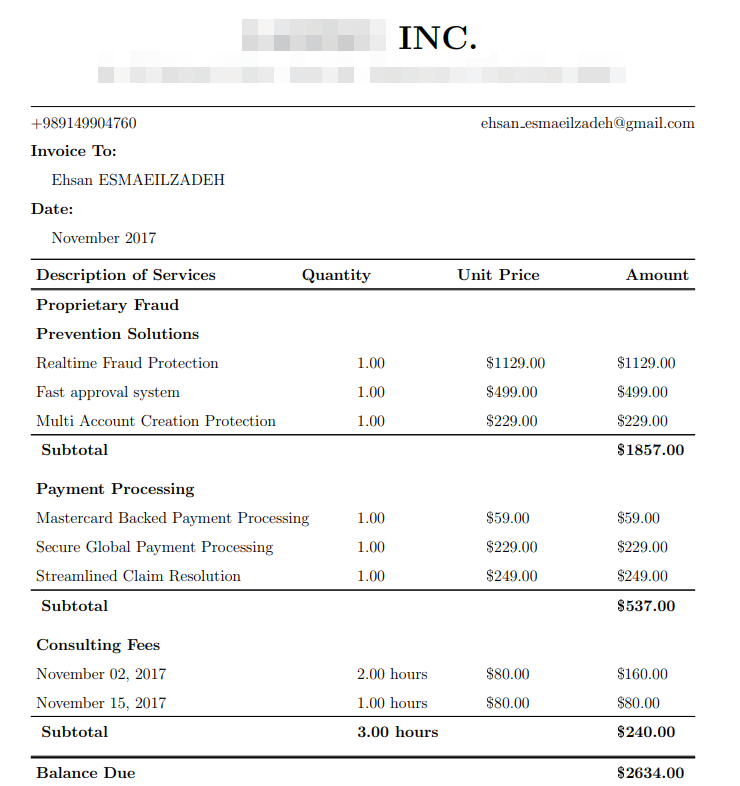
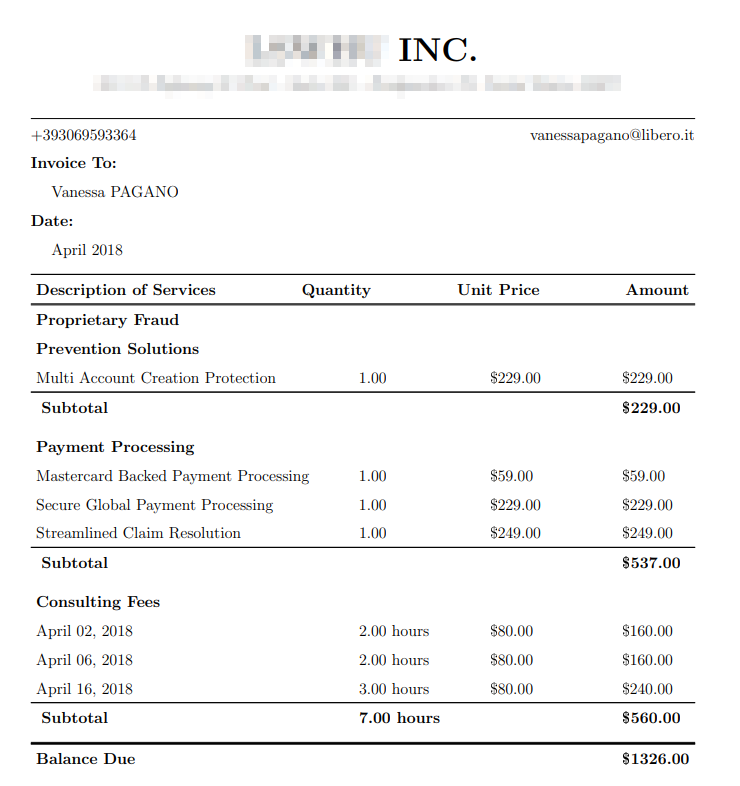
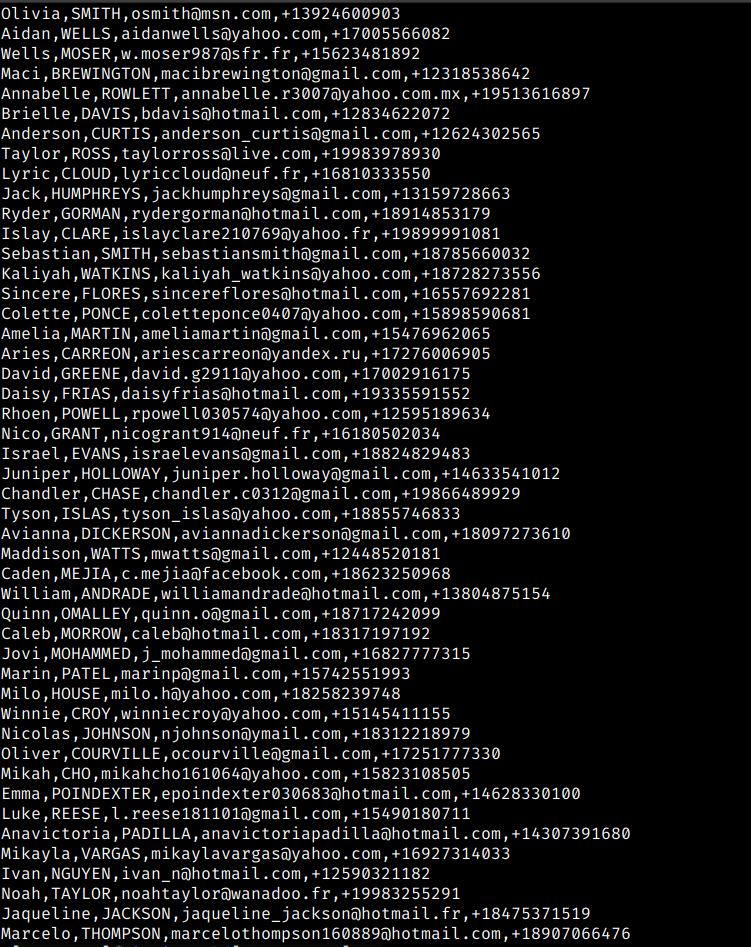
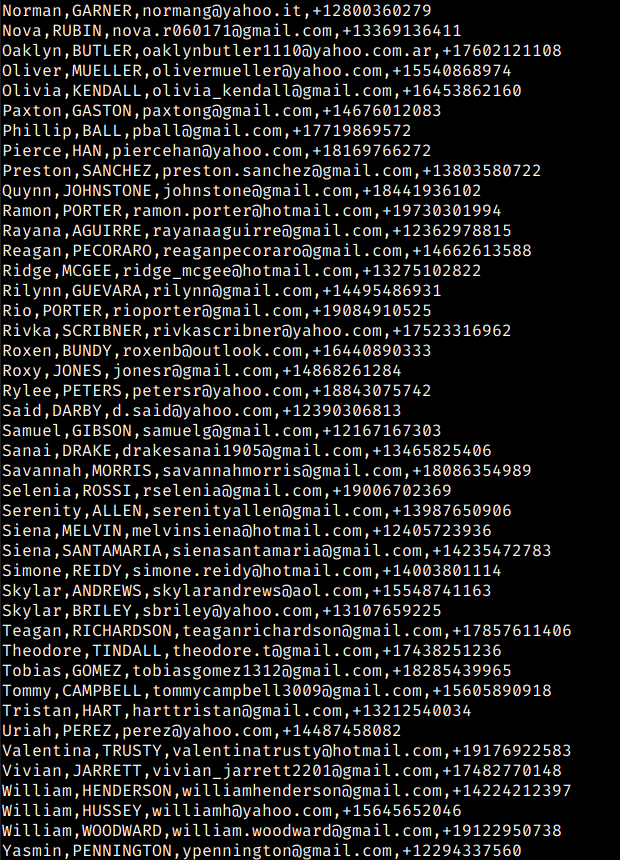
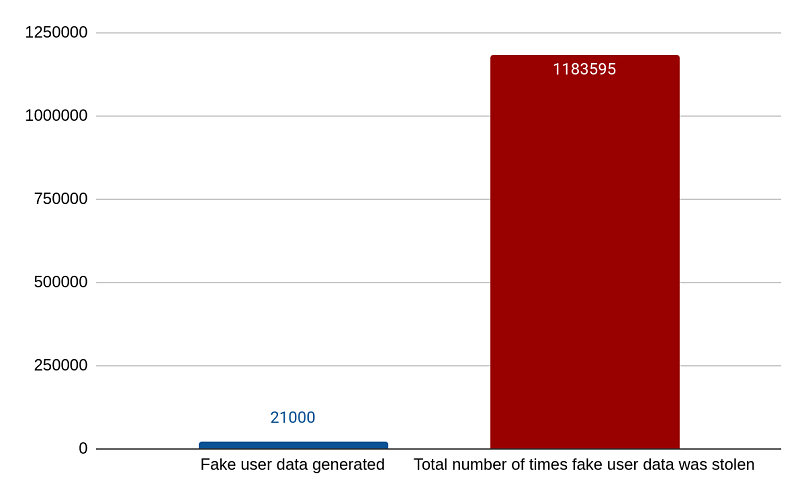
Various files (with a total size of 7GB) were distributed among the servers, with most of them in the main S3 bucket directly linked to the website. They contained fake source code and database files, but the bulk of the data were invoices and CSV files of 21,089 fictitious individuals. The fake user data exposed first and last names, email addresses, and telephone numbers.
To assess whether hackers are more interested in certain regions, we organized the data according to the following countries:
- United Arab Emirates (AE): 299 users
- Australia (AU): 284 users
- Brazil (BR): 1078 users
- Canada (CA): 1749 users
- China (CN): 1087 users
- Spain (ES): 688 users
- Finland (FI): 353 users
- France (FR): 1418 users
- United Kingdom (GB): 605 users
- Israel (IL): 478 users
- India (IN): 1214 users
- Iran (IR): 362 users
- Italy (IT): 1020 users
- Japan (JP): 112 users
- Mexico (MX): 1449 users
- Netherlands (NL): 551 users
- Russia (RU): 237 users
- Sweden (SE): 708 users
- Turkey (TR): 788 users
- Ukraine (UA): 129 users
- United States (US): 6480 users
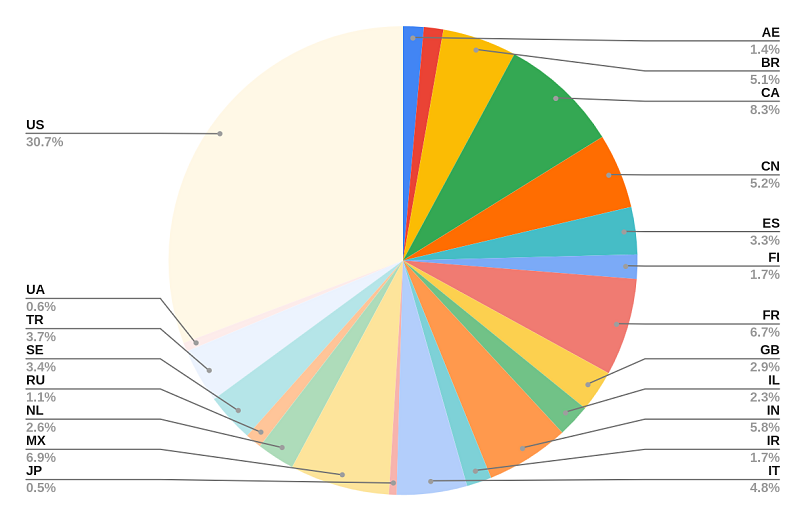 The chart above shows the distribution of fake user data per country.
NOTE
Although a honeypot with equally distributed user data per country would likely yield results that are easier to analyze, we opted for a more nuanced distribution to make the dataset believable.
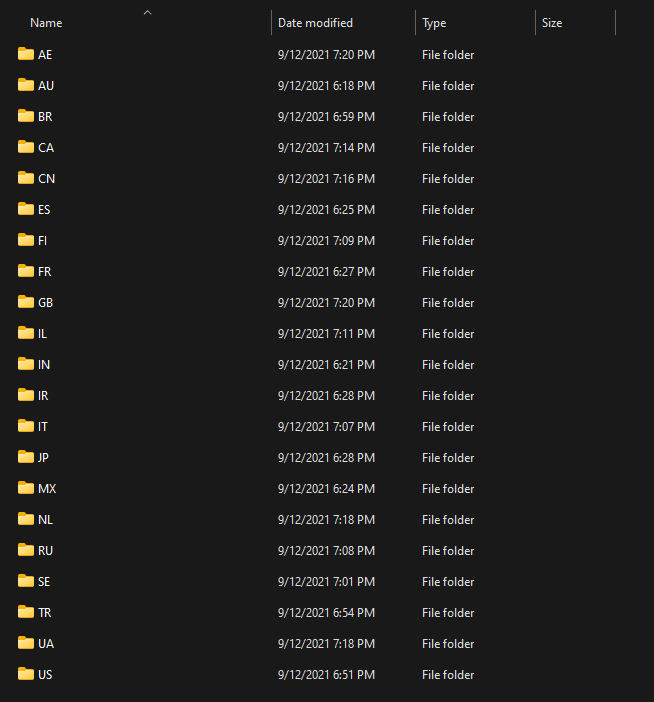
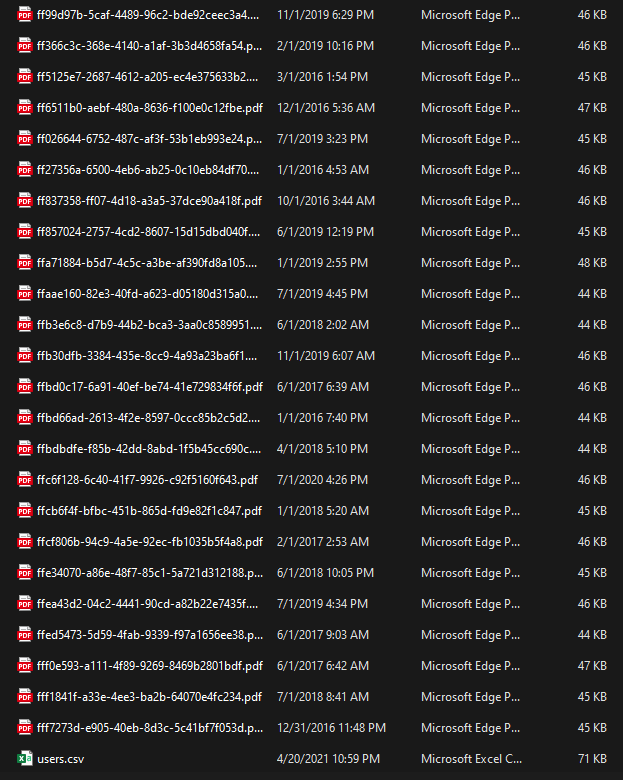
Within the main S3 bucket, country-classified folders (identified by the two-letter country codes) contained multiple PDF files displaying fake users’ invoice data and a single CSV file with all the contact information for that country. In total, the bucket contained 115,669 PDF files and 21 CSV files.
-
- "Please note that all the data exposed here is fictional and any resemblance with true data is coincidential"

-

- "Please note that all the data exposed here is fictional and any resemblance with true data is coincidential"

-
- "Please note that all the data exposed here is fictional and any resemblance with true data is coincidential"

-
- "Please note that all the data exposed here is fictional and any resemblance with true data is coincidential"

-
- "Please note that all the data exposed here is fictional and any resemblance with true data is coincidential"

-
- "Please note that all the data exposed here is fictional and any resemblance with true data is coincidential"

-
- "Please note that all the data exposed here is fictional and any resemblance with true data is coincidential"

The country folders were located in a backups/ folder with the sensitive data not referenced elsewhere. The bucket also contained a folder called images/, with 4 website-hotlinked images used as a breadcrumb trail for attackers to follow from the website to the main S3 bucket.
Meanwhile, the other servers mostly had encrypted.zip files with no real data inside. We set the encryption passwords to be strong enough to prevent outside actors from opening the.zip files.
Our honeypot architecture made it possible to detect whenever an outside actor wanted to view the files inside a bucket. Thus, concentrating the fake sensitive user data in the main S3 bucket, while leaving the secondary buckets virtually empty, allowed us to better track and analyze patterns.
CHRONOLOGY
2020
| June 3 | The fake fraud detection services company website was published. |
2021
| March 24 | The AWS S3 buckets were created. |
| March 29 | The fake user data generation program was designed. |
| April 11-14 | The generation program was implemented, and the necessary fake user data (common names, surnames by countries, country, phone code, etc.) were collected. The fake identities were generated within a minute, while the fake invoice PDFs took 4 hours to create. |
| April 22 | The Google and Azure servers were created. |
| April 29 | The honeypot was deployed, and all the cloud storage systems were configured to be accessible by the public. |
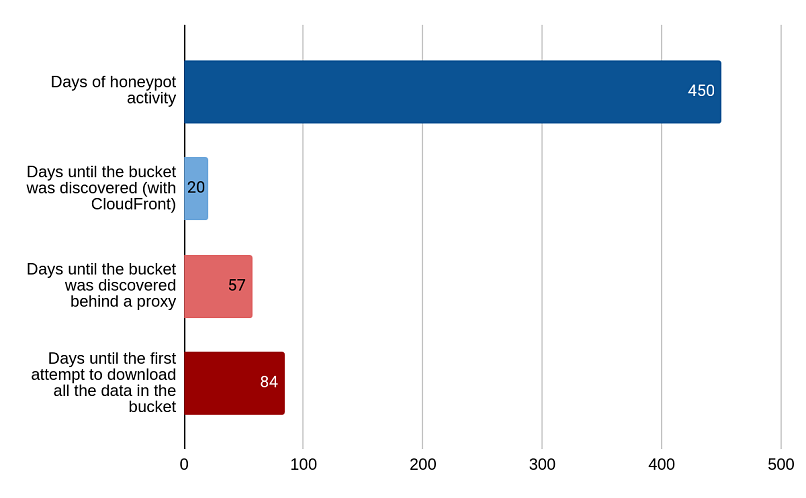
| May 18 19 days from honeypot deployment |
We received the first hint of the main S3 bucket being discovered manually. An actor visited the CloudFront URL for the bucket; favicon.ico* at the CloudFront URL was also requested.
*favicon.ico refers to the icons appearing in browser tabs to identify websites or web pages. The presence of favicon.ico requests indicates that the servers were accessed via a browser. |
| June 24 56 days from honeypot deployment |
First time the honeypot was visited without the CloudFront proxy, indicating that a malicious actor intentionally sought improperly set-up or unsecured S3 buckets.
The request originated from Zagreb, Croatia and came with “Go-HTTP-client/1.1” user-agent*, which points to prior knowledge of the bucket’s existence, either through visiting the CloudFront proxy beforehand or receiving information shared by web crawlers. *An automated tool written in Go programming language made the request. |
| July 18 80 days from honeypot deployment |
The honeypot started getting requests from AWS SDK*. A bad actor used the “aws s3 ls” command to obtain a list of all the files in the bucket from a server belonging to “Hetzner Online GmbH", Finland.
*The bucket was investigated through its same AWS command line; the request could have been made by an individual conducting manual scrutiny of the bucket or another automated software using the AWS command line tool. |
| July 22 84 days from honeypot deployment |
We received the first direct requests attempting to download all the “sensitive” files inside the bucket. |
The first 2 months of the experiment saw little to no interaction from outside actors. Thus, we decided to restrict public access to our servers and aggregate the results on July 14, 2022, close to a year after the first malicious activity request.
NOTE
S3 configurations are notoriously difficult to mess up due to the numerous confirmations and warning messages in the S3 cloud panel. The following show examples of warning messages and hurdles deployed by Amazon Web Services to prevent the intentional misconfiguration of our S3 buckets:
 The owner has to opt out of all constraining settings.
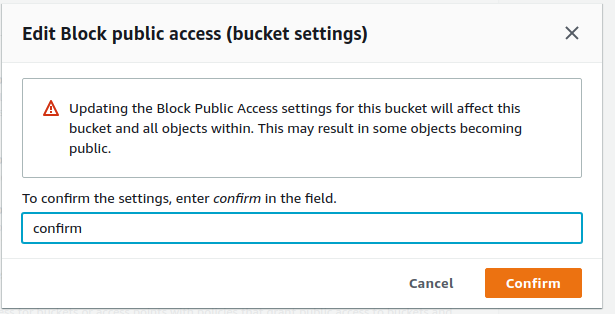 Amazon displays a warning popup, wherein the owner has to manually confirm the setting changes.
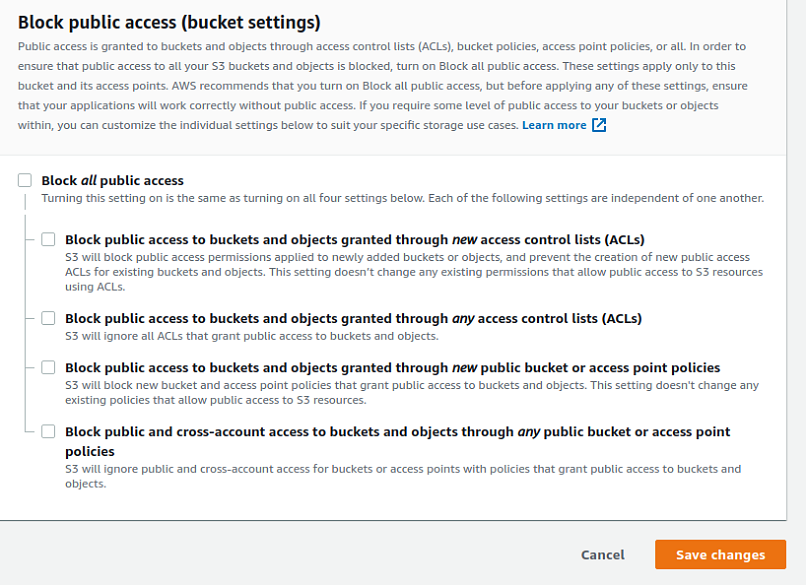
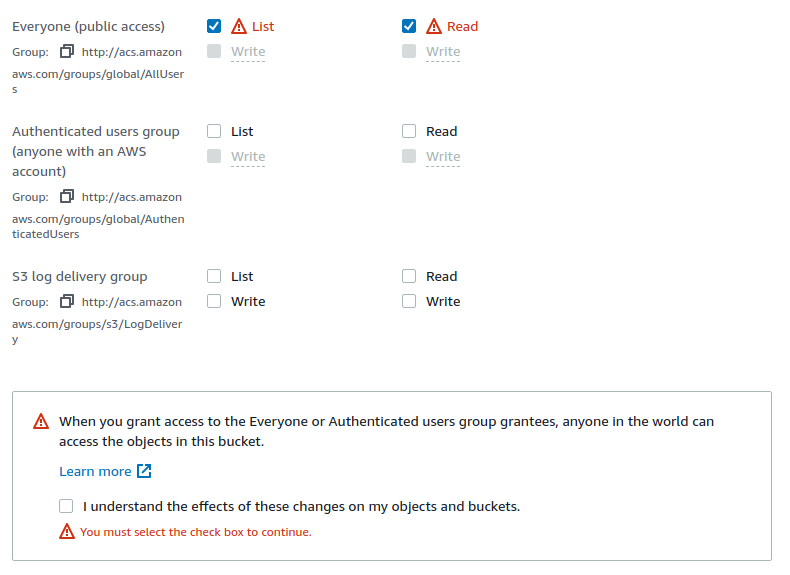 Amazon shows bright red “danger” signs beside settings that would make S3 buckets public and unsecure. There is also a bubble notification clearly stating the hazards of granting public access to buckets. The owner has to confirm the decision by ticking the checkbox.
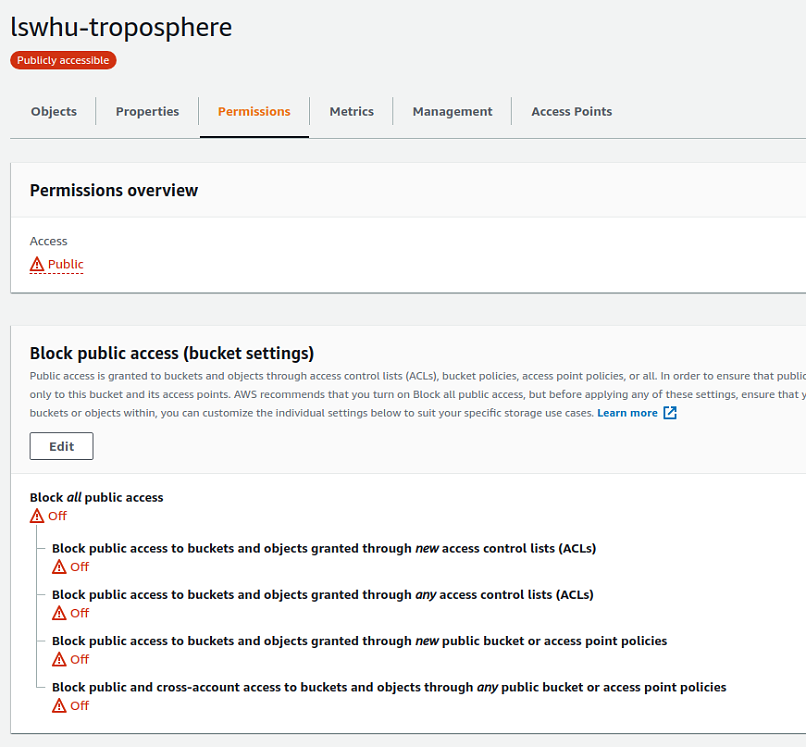 Once public access has been granted, the bucket settings page will constantly display the “danger” signs until the settings are modified.
Although they may seem excessive, it is worth noting that tens of thousands of companies have made mistakes in this area.
Results and Statistics
In total, we generated data for 21,089 fake users. While the Google Cloud Storage and Azure Blob Storage servers were not discovered once, the data in the Amazon AWS S3 buckets were accessed a total of 770,000 times over the course of 14 months. This is the breakdown of data points gathered after the research:
Over 450 days, we logged an average of 1,720 requests per day, over 99% being malicious.
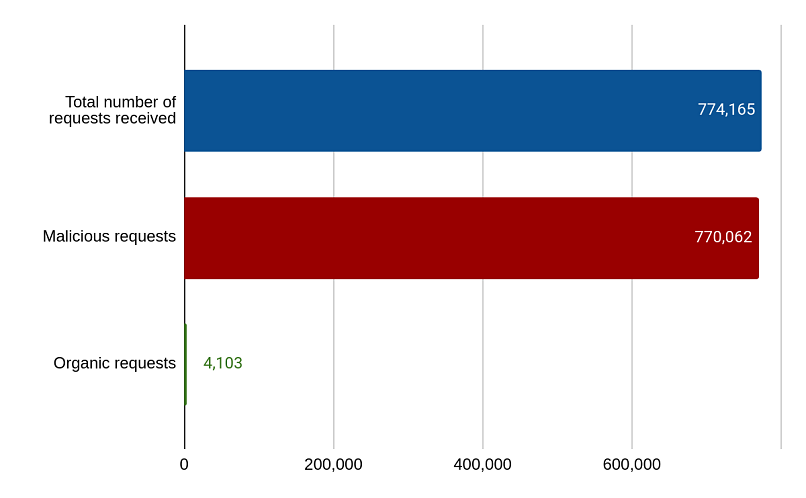
One request refers to one browser action to access our storage servers, such as visiting a web page, loading images, or downloading files. Requests related to loading website images were considered organic — such would be the ones received had we properly secured the bucket. All other requests were considered malicious.
Also, we operated under the assumption that all non-browser requests were made by bots, but we did not treat all browser requests as human-made. Moreover, we expected recurring visits but did not implement a tracking system for them because outside actors can simply change IP addresses through their VPNs.
Amazon AWS S3 Bucket Activity
One AWS S3 bucket had a generic name that did not include the company or website title (http://invoices-up.s3.amazonaws.com/), which means no breadcrumb trail connected it to the rest of the honeypot. Despite this, bad actors still managed to discover the bucket after 210 days of being exposed. This indicates that giving buckets names unaffiliated with their company or organization is not enough to protect them from hackers. Additional safeguarding steps are still necessary and crucial.
The discovery of the two control S3 buckets ([website]-dev and [website]-staging) could indicate the use of either a public or private discovery tool, as these two suffixes are the most generic and are checked by all S3 finder tools.
However, we recorded exactly two instances of the same IP address accessing more than one bucket:
- A single IP address accessed 3 different buckets:
- [website].s3.amazonaws.com
- [website]-dev.s3.amazonaws.com
- [website]-staging.s3.amazonaws.com
- A single IP address accessed 2 different buckets:
- [website].s3.amazonaws.com
- [website]-dev.s3.amazonaws.com
The actions above suggest that bad actors found the main exposed S3 bucket and sought for alternate bucket names from the same organization/company name.
Meanwhile, the discovery of the other buckets specifically points to open-source S3 discovery tools. Specifically, we observed the use of the following tools:
- PyLazyS3 for files-attachments-[website]
- insp3ctor for [website]-internal-dist
- amass for webdisk.billing-[website]
We were only able to confirm the use of 3 out of 10 discovery tools we tested for. Still, any of the other 7 tools could have been used. Since the prefixes and suffixes we selected were unique to each discovery tool, some were likely at the bottom of their respective lists.
Suppose a finder tool has a list of 2,000 possible bucket names, and a malicious actor ran it for approximately 500 names. If our bucket name was at the bottom, they would not have found the match, preventing them from discovering our bucket.
- Brute forcing: Bad actors repeatedly scan storage names to identify a valid one without any initial leads. This was the case with the S3 bucket with no website name (http://invoices-up.s3.amazonaws.com/) — a hacker stumbled upon the bucket name through automated trials.
- Hotlink following: Bad actors scour websites for any links to storage servers and then follow them as a breadcrumb trail to reach those servers. This happened to the main S3 bucket, where hackers followed the trail from the website.
- Suffix/prefix fuzzing: Bad actors search for bucket names that are variations of already discovered servers. This was observed when outside actors searched for alternate bucket names after discovering the main S3 bucket, leading them to find the control servers ([website]-dev.s3.amazonaws.com and [website]-staging.s3.amazonaws.com).
Google Cloud and Azure Blob Storage Servers
The Google Cloud Storage and Azure Blob Storage servers were not discovered once, presumably because they were not hotlinked anywhere, so they could not be found through hotlink following. Also, the servers contained the company name, so they could not be found by brute forcing either.
These findings suggest that malicious actors are probably not utilizing suffix/prefix fuzzing cross-platform, such as searching for similar storage names in Azure after finding a bucket name in S3. This outcome is also a testament to how S3 buckets are more popular and widely used than other platforms.
Azure Blob Storage servers are more complicated to navigate, which likely contributed to the server not being discovered. Additionally, Microsoft Azure’s tools cannot list all the files contained in larger blobs, unlike in S3 buckets.
Amazon Web Services is also more well-known than Google and Microsoft Azure’s services. This experiment saw zero interaction for the non-primary storage servers. However, an experiment with Google Storage or Azure Blob servers as the main storage units and S3 buckets as secondary would most definitely catch traffic for the non-primary S3 buckets. This is because external actors would likely take the Google or Azure server names they discover and use them for suffix/prefix fuzzing with S3 buckets.
Being the most popular platform, it is thus clear why Amazon deploys several warnings and steps against misconfiguration. It is more cost- and time-efficient for attackers to find unsecured and improperly set-up S3 buckets.
Google and Azure did not present us with the same number of warnings and steps to protect against accidental misconfiguration. However, for both instances, it still took intentional effort because it is not a default setting to grant public access to servers. The settings were also clear enough for users to know what tinkering with them would result in, but there were no repetitive confirmation requirements.
On the other hand, Amazon put in place safeguards to ensure that users would be fully aware of all the possible consequences of intentionally misconfiguring servers.
DISCLAIMER
The platforms cited here (Amazon Web Services, Google Cloud Storage, and Azure Blob Storage) are not to blame for the vulnerabilities and stolen fake user data. All public access settings were misconfigured intentionally for the purposes of this experiment.
Fake User Data Requests
Our logs revealed that outside actors did not always download the entire contents of our main S3 bucket. Instead, some file types were prioritized over others. Specifically, CSV files received a much higher average download count than PDF files.
| File Type | # of Files | # of Requests | Average Download |
| 115,669 | 773,224 | 6.68 times per file | |
| .csv | 21 | 361 | 17.19 times per file |
The figures and outcomes above show that external actors likely had malicious intent in accessing the exposed fake user data. Since CSV files contained an aggregate of the contact information of all fake users per country, they could be considered more valuable and useful than individual PDF files. They also allowed hackers to more easily sort through and organize the obtained data.
Analyzing the data as a whole, we are unable to draw conclusions as to what countries were most targeted by malicious actors because of the uneven distribution of fake users per country. However, since we know that the hackers had more interest in the CSV files than the PDF files, we surveyed the download log of CSV files per country.
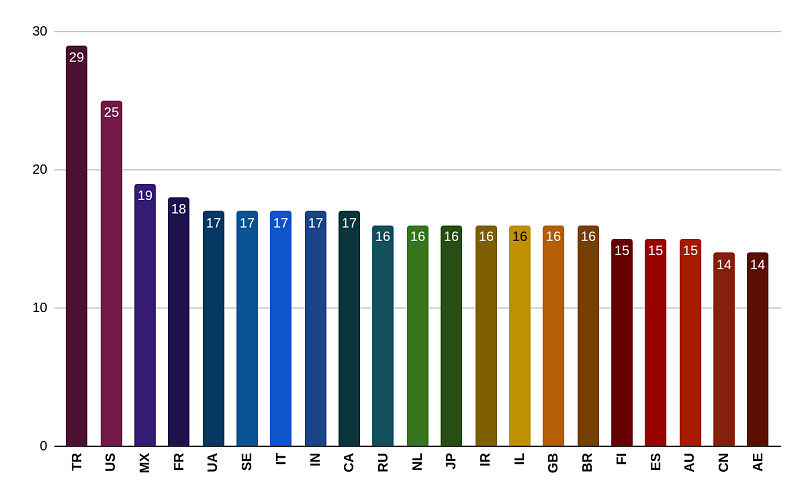 The graph above shows how many times the CSV files for each country were downloaded.
The top 3 countries in terms of CSV file downloads are Turkey, the US, and Mexico.
The US is responsible for most of the marketing industry’s global revenue. Over 50% of the world’s top marketing agencies are headquartered in the US. Additionally, being home to several of the biggest companies worldwide, the demand for marketing services within the country is consistently high. This makes any US-based user data and contact information valuable, as they can be sold as marketing leads and prospecting lists.
US-based citizens are also frequent targets for telephone scammers from inside and outside the country. Federal and state governments have repeatedly issued warnings about known schemes and have urged the public to report incidents. In this vein, we can also assume that US data stolen from our fake database could be used for such scams.
Likewise, Turkey and Mexico also have rampant call scam problems. In Turkey, an estimated average of 60 people report to the prosecutor’s office daily after being defrauded by telescammers. Meanwhile, authorities have claimed that Mexican cartels have recently been boosting their scam call operations to fund their activities.
Other notable countries include Ukraine, Japan, and China. Ukraine and Japan — with only 129 and 112 fake users, respectively — had the least amount of data in the honeypot. In spite of this, the CSV file for Ukraine logged the 5th highest download count, while Japan made the top 10.
The volatile political situation in Ukraine could have been a major driver of interest. Meanwhile, Japan has been struggling with a growing number of cases of hacking and other types of cyber attacks, including ransomware and Distributed Denial-of-Service (DDoS) attacks targeting government websites and crucial industries.
In recent years, the Japanese government has discussed taking more proactive and concrete measures to combat foreign hackers. For instance, there have been talks of amending existing legislation to allow them to conduct cyber offensives for purposes of defending their virtual infrastructures.
Hacker activity in our honeypot’s China folder was much different. The country was the 6th most saturated with fake data (1,087 fake users), yet it saw the least number of CSV downloads. A possible contributing factor is the country’s strict internet censorship laws. With the people’s data and online activity being meticulously monitored and controlled, there is little room for social manipulation attacks (e.g., phishing) or marketing maneuvers targeting Chinese citizens.
Additionally, China has been named by Freedom House as a leading source of cyberattacks worldwide. China-based hackers have repeatedly breached corporate and government resources in the US and other Western countries.
Given all the trends spotted by examining CSV downloads, our team can safely assume that outside actors’ malicious intent in accessing and acquiring our fake data was influenced by the sociopolitical climate in various countries.
Inserted below are samples of the data logged and gathered over the duration of the experiment.
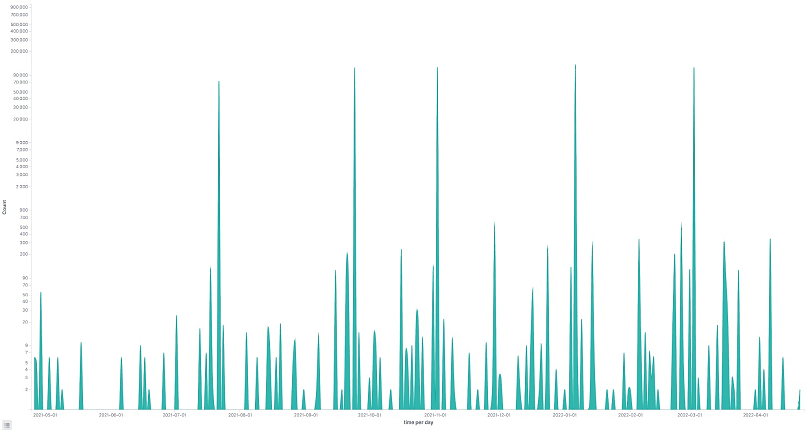 The graph above shows the log of requests received per day.
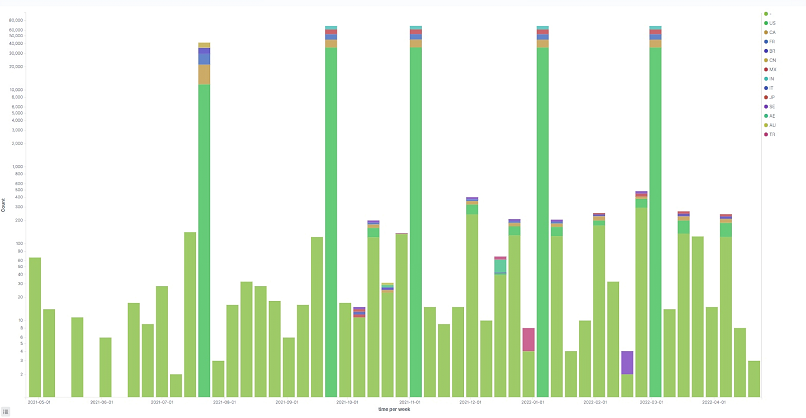 The graph above shows the log of requests received per day split by the countries affected.
Malicious Outside Actors
We operated under the assumption that malicious actors would have used VPNs to access our honeypot. Still, we can consider it likely that their actual points of origin are within the neighboring regions of the locations logged.
 The graphic above displays a map of the origin of all requests received.
IMPORTANT
Given the assumption that external actors used VPNs, we do not claim that the above heatmap displays the real whereabouts and saturation of the hackers.
Here’s a breakdown of the malicious activity requests broken down by the operating systems (OS) and browsers used by the external actors:
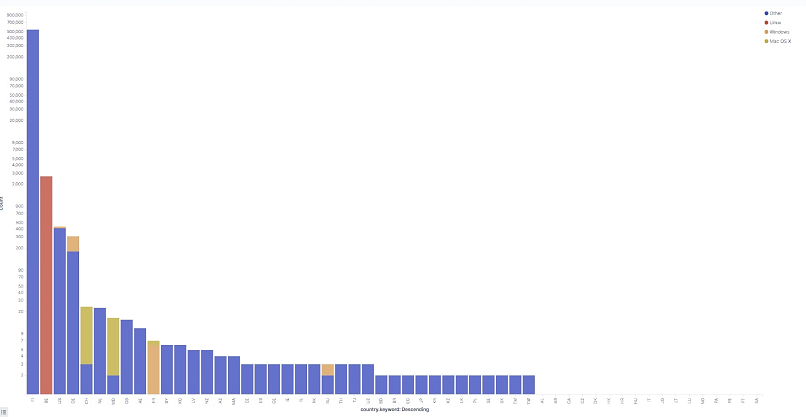 The graph above shows the per-country breakdown of requests per operating system used.
| Operating System | # of Requests | % of Requests |
| Other requests from tools (not browsers) that do not report OS data |
768,022 | 99.74% |
| Linux | 1,922 | 0.25% |
| Windows | 76 | 0.01% |
| Mac OS X | 28 | 0.00% |
| iOS | 14 | 0.00% |
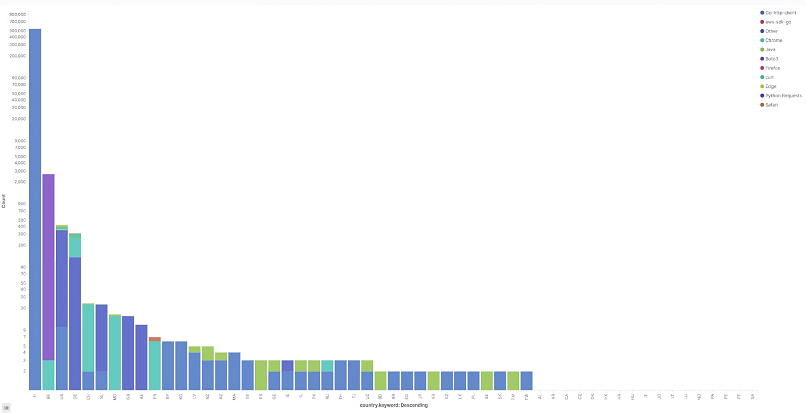 The graph above shows the per-country breakdown of requests per browser used.
| Browsers | # of Requests | % of Requests |
| Go-HTTP-client a user-agent associated with the Go programming language |
767,113 | 99.62% |
| Boto3 the latest AWS SDK version with Python compatibility |
1,922 | 0.25% |
| Other all other user agents of mostly other programming languages |
743 | 0.10% |
| Chrome any Chrome-based version or platform |
102 | 0.01% |
| Curl a command line tool to view website contents through the terminal |
84 | 0.01% |
| Python an all-purpose popular programming language |
82 | 0.01% |
| Mobile Safari | 14 | 0.00% |
| Firefox | 2 | 0.00% |
NOTE
The recorded use of Safari mobile to access our honeypot and attempt to steal user data highlights how vulnerable servers are when not properly secured. Investigating an exposed server with a browser is complicated enough; attempting to do so using a mobile phone raises more alarms in terms of how easy it is to steal confidential data when they are left in misconfigured servers.
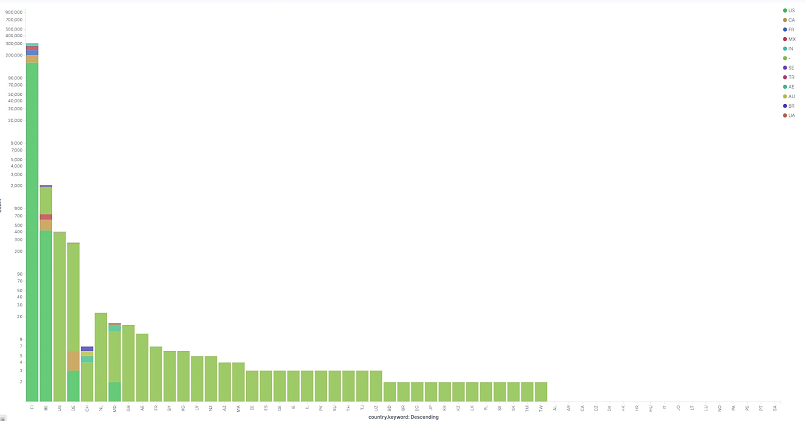 In the graph above, the x-axis shows the countries from where the requests originated from. Additionally, each bar is divided according to the affected countries.
As of restricting access to the honeypot, no outside actor ever reached out to us about the leaked data. The email address that was set up for purposes of ethical disclosure only received spam mail.
We did not find any evidence of our fake user data being sold, traded, or otherwise shared over the dark web. Still, it could have been peddled as lead lists to marketing firms or prospecting companies.
One of the most recent such incidents involved Klaviyo, a global marketing automation tech firm. Cyberattackers used an employee’s compromised login credentials to access the company’s systems. The hacker then stole data related to cryptocurrency accounts and marketing lead lists.
A Deep Dive Into Data Breaches
The top driver of malicious activity involving data breaches is financial, with over 90% of outside actors showing related motives. Moreover, Verizon’s 2022 Data Breach Investigations Report (DBIR) states that 82% of breaches in the past year involved the human element. This risk factor is seen most prevalently in the following incidents:
- Lost assets: credentials or files misplaced or stolen with malice
- Errors: carelessness, security weaknesses, infrastructure oversight, misconfiguration
- Misuse: malicious intent to abuse asset access privileges
- Social engineering: deception, manipulation, or intimidation to force an actor to expose assets
Insider threats can cause as much damage as outsider hacking. Weaknesses in a company’s or organization’s data infrastructure can attract outside parties to access your files. While “white hat” or ethical security hackers often notify you of the vulnerability, more malicious actors could exploit your information silently.
The Cost of Data Breaches
In 2021, IBM’s Cost of a Data Breach Report stated that human error-related breaches often take longer to identify and contain, making them some of the most expensive forms of data breaches.
In 2022, the study still noted a strong correlation between security-related skills shortage and expenses linked to data breaches. In its survey of 550 organizations affected by data breaches across 17 countries and industries, 62% of the respondents stated that they did not have proper security skills and staffing. As a result, those with skills shortages see an average of 4.56 million USD in data breach costs versus 4.01 million USD for those with sufficient security measures.
The Most Vulnerable Industries and Regions
According to Verizon’s 2022 DBIR, the finance industry suffered the most data breaches, followed closely by the professional, scientific, and technical services field. Other contenders for the most affected industries include healthcare, public administration, information, and manufacturing.
In 3 out of 5 of the most affected industries, error (neglect or mistakes) accounts for the 3rd highest cause of breaches, next only to brute force hacking and malware. Meanwhile, it is the 2nd most common breach action for the healthcare industry and 4th for professional services, following social engineering.
Regarding country and region breakdowns, Russia was most affected by data breaches at 104.8 million recorded cases, ranking first in the list from January through September 2022 and making Eastern Europe the region with the most data leaks. It is followed by China, with around 34 million breached accounts and data.
Safeguarding Sensitive Data Against Malicious Use
Data breaches can have severe and long-lasting negative impacts on businesses, institutions, governments, organizations, and individuals. For instance, the costs associated with compromised files can be disastrous for companies’ financial health. It can also damage the business’s reputation among consumers.
Such was the case with First American Financial Corp., the title insurance provider and real-estate service firm. A web design oversight allowed 885 million files to be exposed, with information such as bank account numbers, mortgage documents, driver’s licenses, and social security numbers. Reportedly, the leaked data was not exploited, but the firm was fined 500,000 USD by the Securities and Exchange Commission (SEC).
Another high-profile data leak involved Facebook and Cambridge Analytica, the British firm that sold up to 90 million account data. After being discovered to have neglected addressing existing security issues for around 3 years, the Federal Trade Commission (FTC) fined Facebook 5 billion USD and ordered an infrastructure reconstruction. Cambridge Analytica also suffered a lawsuit.
Government assets have an even higher threat model, as any leak can jeopardize national security by exposing sensitive political dealings or confidential military plans. Meanwhile, individuals can fall victim to identity theft, fraud, and other crimes when malicious actors access their PII and other sensitive data.
How to Prevent Data Breaches
Given the prevalence of data breaches caused by neglect, oversight, or other human errors, it is crucial to urgently address online and offline security infrastructure vulnerabilities. Here are some ways to boost asset confidentiality and integrity to prevent or minimize the impact of error-caused leaks:
- Integrate a Zero-Trust security model to unauthorized access of confidential assets.
- Set a clear privacy and disclosure policy among colleagues and employees.
- Regularly update third-party security software to activate patches addressing existing loopholes.
- Invest in cloud security measures, such as high-grade encryption for sensitive files.
- Formulate and regularly test the effectiveness of incident response plans alongside threat prioritization measures to reduce or manage data breach costs.
Aside from miscellaneous errors, other forms of weaknesses could also be exploited by hackers. These include the following:
- Weak, lost, or stolen credentials, such as user company identification
- Untrustworthy third-party access, such as malicious vendors
- Unsecured portable devices, such as hard drives and mobile phones
The above-mentioned risk factors and breach entry points highlight the significance of educating members of organizations or businesses to avoid falling prey to social engineering or malware attacks.
Key Takeaways
It took less than 3 weeks for outside actors to find our exposed servers. Around a month later, we observed conclusive proof of someone sniffing around our honeypot with malicious intent. Within another 4 weeks, we logged the first attempt to download the sensitive files within the servers. So, we can infer a company or organization with misconfigured servers could have their sensitive files compromised within less than a month.
In the 14 months that our honeypot was exposed, fake user data was accessed, acquired, and presumably exploited over 700,000 times. This calculates to roughly 50,000 downloads per month. In addition, the fact that no outside actor ever reached out to us about the vulnerability suggests that companies or organizations unaware of security weaknesses in their servers could expect more significant data leaks.
Data breaches and leaks can lead to identity theft, financial losses, reputational damage, and other types of fraudulent or criminal activities. Given the persisting trend of security incidents influenced by human error or negligence, it is ever more imperative to study and put in place measures to protect sensitive business and personal information.
In corporate or organizational settings, training and educating employees and other essential staffing plays a significant role in spotting and preventing potential threats, thus reducing the likelihood of data breaches and other security incidents. Not only will doing so safeguard individuals from fraud, but it can also ensure that valuable company or organizational assets are not compromised.
About the Author
vpnMentor Research Lab is a pro bono service that strives to help the online community defend itself against cyber threats while educating organizations on protecting their users’ data.
Our security research team has discovered and disclosed some of the most impactful data breaches in recent years.

Please, comment on how to improve this article. Your feedback matters!